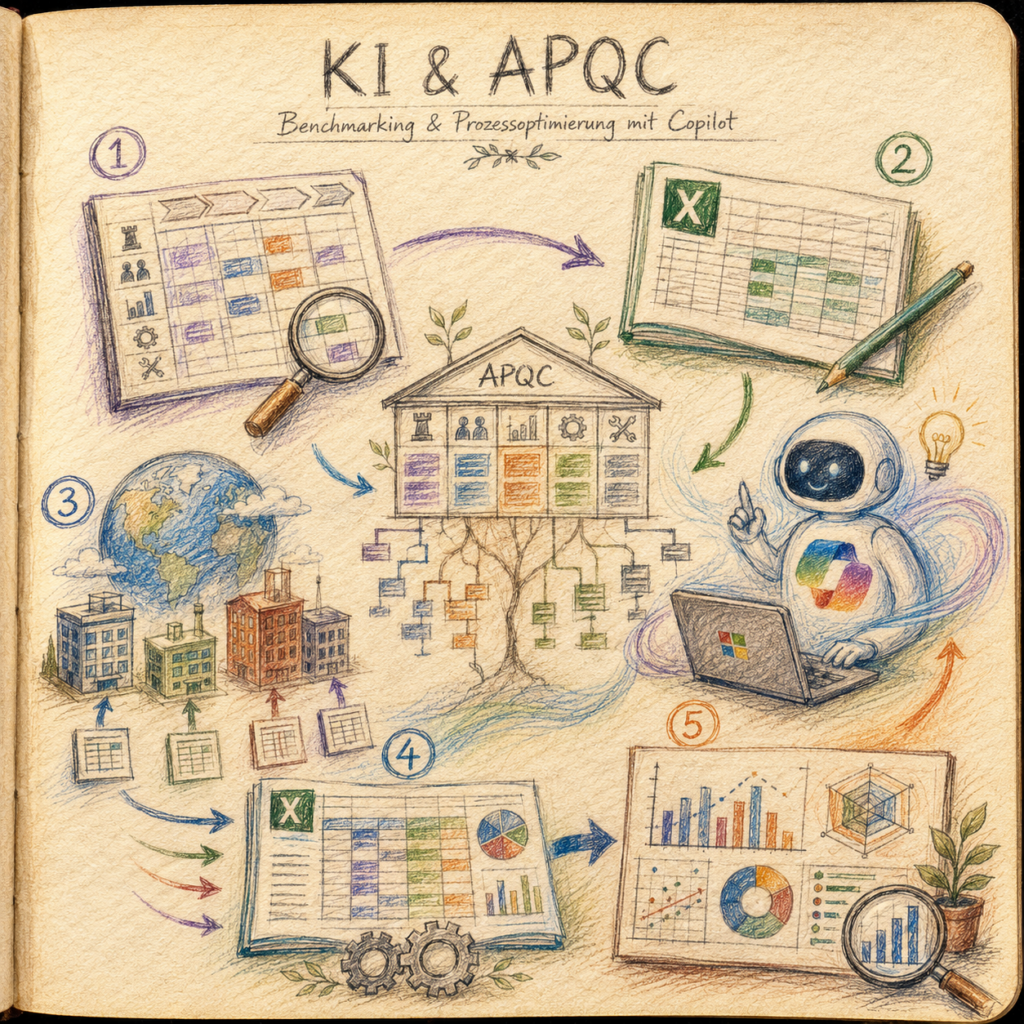
There is a particular moment in almost every large corporation that always plays out the same way. Someone from Controlling asks: “Are we actually efficient? How do we compare to our own subsidiaries?” And then comes the reflexive follow-up: “Shouldn’t we bring in a consultancy for that?”
Consulting firms specialize in answering exactly this question — for a fee that is simply beyond the budget of most mid-sized companies and many corporate divisions. This guide shows you a different path. You only need two ingredients, both of which are either free or already available: the APQC Process Classification Framework (a nonprofit, freely usable process taxonomy — more on that shortly) and Microsoft Copilot as a sparring partner and tool. The end result is not a consulting report, but your own repeatable benchmarking system that you built yourself.
To make this guide easier to follow, three characters accompany you throughout:
The typical office archetypes: the competent IT colleague, the self-proclaimed expert, and the honest beginner. These three perspectives help you spot common pitfalls.
Tanja is the IT expert. She knows how things work, explains patiently and systematically — and stays calm in the face of bad advice. When you have a question, Tanja has the answer.
Bernd is the self-proclaimed “expert” who knows everything better — and is usually wrong. His shortcuts and half-knowledge regularly cause problems. He represents all the dangerous myths and bad practices you should avoid.
Ulf is the learner, just like you. He asks the questions that are swirling around in your head, and sometimes needs an everyday analogy to understand IT. When Ulf doesn’t understand something, that’s perfectly fine — that’s what Tanja is there for.
“And… action!”
Scene 1: The Coffee Kitchen, Just Before the Consulting Contract
Bernd: “I heard. So now we need to figure out whether we have too many people in accounting. I’ll just bring in a consultancy — they’ll give me a nice slide in three months.”
Tanja: “Or we build it ourselves. With a free process standard and Copilot.”
Ulf: “Wait, benchmark — isn’t that just like a league table? Who’s on top, who’s at the bottom?”
Tanja: “Exactly that principle, yes. A benchmark is a systematic comparison of metrics between units — in our case, between subsidiaries. Except instead of counting goals, we compare FTE — full-time equivalents — against workload volume.”
Bernd: “Sounds like a lot of effort for something you could just estimate.”
Tanja: “What’s actually interesting here isn’t the finished spreadsheet at the end. It’s watching how an off-the-shelf AI model like Copilot behaves as a tool for serious, methodologically rigorous work. It shines in some areas, and it lies in others — in this case, for example, by inventing process numbers and hallucinating a download link. With clearly formulated, carefully crafted prompts (these are instruction texts for an AI model), you can still get it to work reliably.”
Ulf: “So this is also a bit of a guide on how to get a stubborn team player on track?”
Tanja: “Pretty much exactly that. And this guide is intentionally long and very specific. It’s not inspirational reading — it’s a construction manual. Every step gets the exact prompt to copy and the result you can expect, including the spots where Copilot stumbled in real testing. And Bernd, you’re going to stumble at exactly those spots too — I’m warning you now.”
Bernd: “Pff. Show me first what this APQC thing is even supposed to be.”
What Is APQC, Exactly? And Why Not Just Make Up Your Own Categories?
Bernd’s question is legitimate, even if it sounds a bit defiant. Before you send a single prompt, you should know what the entire system is built on.
APQC (American Productivity & Quality Center) is a nonprofit, membership-based benchmarking organization based in Houston, founded in 1977. Its most important product is the Process Classification Framework, or PCF for short — a process taxonomy maintained since 1992 and the most widely used in the world. Think of the PCF as a standardized dictionary for business processes. It breaks down every conceivable activity — from “processing invoices” to “managing inventory” — into 13 categories and four hierarchy levels: category, process group, process, activity. Each element also carries a unique PCF Element ID, which APQC itself designates as such. This five-digit reference number is distinct from the visible hierarchy number (for example, 9.6), and that distinction becomes important later.
Ulf: “Okay, I need a picture for this. Is it like the DFB rulebook?”
Tanja: “Almost perfectly put. Imagine every club had its own rules for what counts as a foul. Then you could never compare two leagues. The PCF is the common rule language for what, for example, ‘accounts payable’ actually means — regardless of whether the subsidiary is in Germany, Japan, or the US.”
Bernd: “We could just invent our own categories — nobody knows APQC anyway.”
Tanja: “That’s exactly one of your most expensive mistakes later on, Bernd. When every subsidiary speaks its own language, you end up comparing apples to freight ships. That’s why the key advantage of the PCF is this: it covers Finance, HR, IT, and practically every other function in a single model — and it’s applicable across industries.”
APQC makes the framework available as a freely accessible resource and explicitly describes it as adaptable for organizations’ own process structures. However, you should not assume the specific conditions for reuse, publication, or commercial use as a given — always check the current APQC terms of use at apqc.org. This is especially important if you want to share results outside your own organization.
There are alternatives, but none of them cover the same ground. ITIL or COBIT cover only IT; SCOR covers only supply chain; and benchmark databases from Hackett or Gartner cost money and provide no open framework. For a cross-functional project, the PCF is therefore practically without an alternative. That said, you should still know its limitations: it is generic, US-centric, and external OSB comparison data is behind a paywall — even if the framework itself is not.
An important note on numbering: the hierarchy number (for example, 9.6 or 4.4.1) shifts between PCF versions. In older editions, Finance = 8.0; in the current version 8.0 (Cross-Industry), Finance = 9.0. The more stable reference across versions is the five-digit PCF Element ID. So you always need to verify the version actually in use — another reason why this project never cites from an AI model’s memory, but always from the attached original file.
Fact Check: APQC in Three Sentences
- The PCF is a free, nonprofit-maintained process taxonomy with 13 categories across four hierarchy levels.
- The hierarchy number (9.6, 4.4.1) shifts between versions; the five-digit PCF Element ID remains stable.
- No competitor covers Finance, HR, IT, and all other functions simultaneously — which is why it is the foundation here.
Screening, Diagnosis, Root-Cause: Three Views of the Same Team
Ulf: “And how do you figure out whether a subsidiary has too many people?”
Tanja: “Not in one look, but in three steps, with increasing effort. Think of it like a scouting process. First the rough scouting report for the whole league, then the video analysis of an individual player who stood out, and only at the end the conversation with the physio about why he’s struggling right now.”
The benchmark works with three evaluation levels — which you must not confuse with the APQC hierarchy levels (this confusion was actually the most costly mistake in the entire project — more on that in the troubleshooting section):
| Level | Question | Metric | Reference Size (Denominator) | Effort |
|---|---|---|---|---|
| Screening | Where to look? | FTE (Full-Time Equivalent) | rough measure such as revenue or headcount | low, for all units |
| Diagnosis | How efficient? | FTE | specific volume driver, e.g. invoices per year | medium, only for outliers |
| Root-Cause | Why, and what to do? | quality, time, complexity | per indicator | high, targeted |
Bernd: “Why three steps? I’ll just look more closely at the outliers and be done with it.”
Tanja: “You do that too — but only after the screening. The trick is the sequence: you invest collection effort only where the cheaper, rougher level has actually flagged a hit. Screening deliberately accepts false alarms. A subsidiary looks expensive because it’s more complex — not because it works poorly. Only root-cause analysis clarifies whether a lean number is genuinely good or just a stopgap.”
Ulf: “So like a player with few shots on goal. Alarm at first — but maybe he just plays a different role in the team.”
Tanja: “Exactly. And that’s why the third level prevents the false conclusion that ‘low FTE always equals good.’ Only quality, time, and complexity show whether lean is truly good — and complexity is the fairness correction that explains why a number may legitimately be high.”
Six core principles run through the entire project and reappear in every one of the following prompts: objective rather than subjective data collection (no maturity-level estimates, but FTE shares may be pragmatically allocated by role), data capture against the official APQC process rather than the department name, no double counting between local and central capture, clear separation of local versus central (HQ/Shared Service), a uniform time period and uniform currency, and — perhaps the most important rule — exactly one primary driver per row. Once a metric combines multiple denominators simultaneously (“shipments + goods receipts + returns”), it can no longer be interpreted.
Fact Check: The Three Levels
- Screening is cheap and broad — it filters, it does not judge.
- Diagnosis costs more, so it is only used for outliers identified in screening.
- Root-cause explains the why and prevents false conclusions like “low headcount is always good.”
Before You Start: What Needs to Be on Your Desk
Bernd: “I’ll just get going — open Copilot and start typing. What could possibly go wrong?”
Tanja: “Quite a lot, as you’ll soon find out. There are a few things that need to be in place first, otherwise you’ll grind to a halt halfway through.”
Before the first prompt is sent, the following should be ready:
- A free APQC user account at apqc.org — required to download the PCF file.
- Access to Microsoft Copilot. For pure discussion and table creation, the M365 Chat Copilot (m365.cloud.microsoft/chat) is sufficient. For the later Excel build, you reliably need Copilot in Excel (edit mode, directly in the workbook) or an agent with real code execution. In the tenant/setup tested here, the pure M365 Chat Copilot could not produce a reliable .xlsx file — it could only deliver a text draft. Since Microsoft is continuously expanding Copilot features (including file-generating agents for Word, Excel, and PowerPoint), you should test the actual file-creation capability in your own tenant rather than relying on this observation.
- Copilot in Excel additionally requires OneDrive with AutoSave enabled. If the Copilot button is missing in Excel, it is almost always due to one of four common causes: missing license, license not refreshed, wrong update channel (Semi-Annual Enterprise instead of Current/Monthly), or disabled “connected experiences.” In corporate environments, the paid Microsoft 365 Copilot add-on is also required — which the IT department must assign.
- The willingness to manually check every file generated by Copilot in Excel. This is not a formality — it is the most important lesson from this entire project: Copilot’s own acceptance report (“all done, Check = OK”) was wrong multiple times during testing, while the actual file contained 0 formulas and 0 data validations.
- Basic Excel knowledge (pivot logic, dropdowns, simple formulas) helps with review but is not a prerequisite for formulating the prompts themselves.
- Clear data privacy awareness. Employee lists, names, email addresses, or any other personal data must not be entered into any of the following prompts, uploads, or comment fields.
Ulf: “Wait — so we don’t enter any names anywhere? Not even who works on what?”
Tanja: “No, nowhere. The prompts themselves explicitly prohibit that in several places — but the responsibility for not uploading the wrong things still lies with the person sitting there, which is you. Work is done exclusively with aggregated FTE figures per process, never with individual persons.”
Bernd: “I’ll just write in the comment that Mr. Müller handles this, so you know who to ask.”
Tanja: “Exactly not that, Bernd. No name, no email address, no employee list. If you want to know who is responsible for what, you sort that out verbally or in a separate, non-AI-supported system.”
Not 1:1 without review: This guide is reproducible, but not autonomous. Every Copilot output — whether table, Excel file, or analysis — must be opened, reviewed, and checked for plausibility before it is used further. No step in this guide replaces this human verification.
The Input Package: What Really Needs to Be in Place Before You Start
Anyone who wants to go through the complete workflow should have these five things accessible before beginning:
- The official PCF v8.0 file from apqc.org (Phase 1).
- A confirmed APQC process selection table — the output of Prompt 1 (Phase 2).
- The template built from it — or the reviewed result of Prompt 2/3 (Phase 3).
- The completed return files from the subsidiaries, one per entity (after Phase 4).
- A manual review checklist (based on the troubleshooting section below) against which every Copilot output is checked.
Fact Check: Ready to Start?
- APQC account in place.
- Copilot access clarified — especially whether real file creation works in your own tenant.
- Willingness to manually review every generated file.
- Clear understanding that no personal data belongs in any prompt or upload.
- All five points of the input package in mind.
Phase 1. The Hunt for the Official Rules File
Bernd: “I know the PCF number for accounts payable by heart — 8.1.2 or something. Do I really need to load the file?”
Tanja: “Yes, absolutely. And you’re already wrong — in version 8.0, Finance is category 9.0, not 8.0. That’s exactly the point: without the actual PCF file attached, Copilot invents process numbers and uses outdated version numbering — for example, HR = 6.0 instead of the correct 7.0. No matter how sophisticated a prompt you write, that cannot be fully fixed. The file must be physically attached.”
The most important operational lever of the entire project is remarkably unspectacular — which is precisely why it tends to be overlooked: the file must be real, not reconstructed from memory.
Step: Open https://www.apqc.org/resource-library/resource-listing/apqc-process-classification-framework-pcf-cross-industry-excel-12 in your browser, create a free account or sign in, and download the Excel version 8.0 (Cross-Industry).
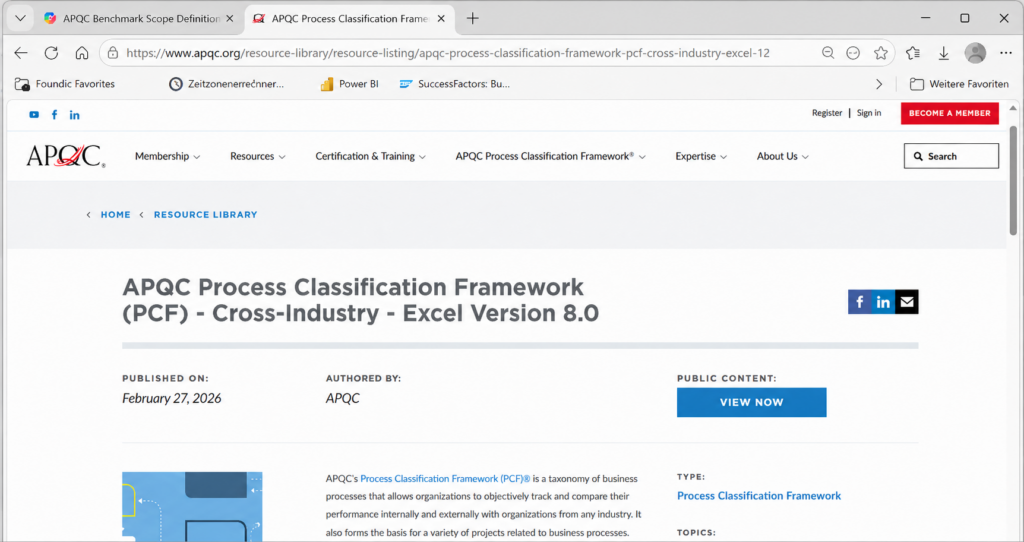
Expected result: An Excel file containing all 13 APQC categories across four hierarchy levels, including the stable five-digit PCF Element IDs. This file is required as an attachment in Phase 2 — it is the only permissible source for process names and numbers there. In Phase 3 it is helpful for verification but no longer strictly required, because the confirmed process selection table from Phase 2 serves as the binding source. From Phase 4 onward, the workbook itself takes on this role (tblProcess in the template or Process_Reference in the master workbook) — the PCF file does not need to be sent along after that point.
Fact Check: Phase 1
- Goal: possess the official PCF v8.0 Excel file.
- Without this file: no real process numbers, only guesswork from Copilot.
- The file is concretely needed only in Phase 2; other sources take over its role afterward.
Phase 2. The Process Selection Paper: The APQC Process Selection Table (Prompt 1)
Ulf: “And now? Do we just message Copilot asking it to analyze our accounting department?”
Tanja: “Not yet. First we build the roster together with Copilot, so to speak. A process selection table specifies which official APQC processes are in scope — with their reference number, their volume driver as denominator, and a scope note. Everything that follows — the Excel template, the completion guide, the analysis — is derived from exactly this one table.”
Bernd: “I’d rather build my own abbreviations — LOG_INB_SCHED for inbound logistics scheduling or something. Much cleaner.”
Tanja: “That’s exactly what crashed spectacularly in a real test run. The colleagues filling in the forms at the subsidiaries simply couldn’t make sense of abbreviations like that. The binding rule is therefore: the APQC process house is adopted 1:1, without custom clusters or invented short codes. APQC already provides unique, written-out names with numbers. These are adopted directly, never reformulated.”
How to Start the Prompt
- Open a new chat in Microsoft Copilot (m365.cloud.microsoft/chat or your preferred Copilot environment).
- Add the downloaded PCF v8.0 file as an attachment.
- Paste the following prompt in full and send it.
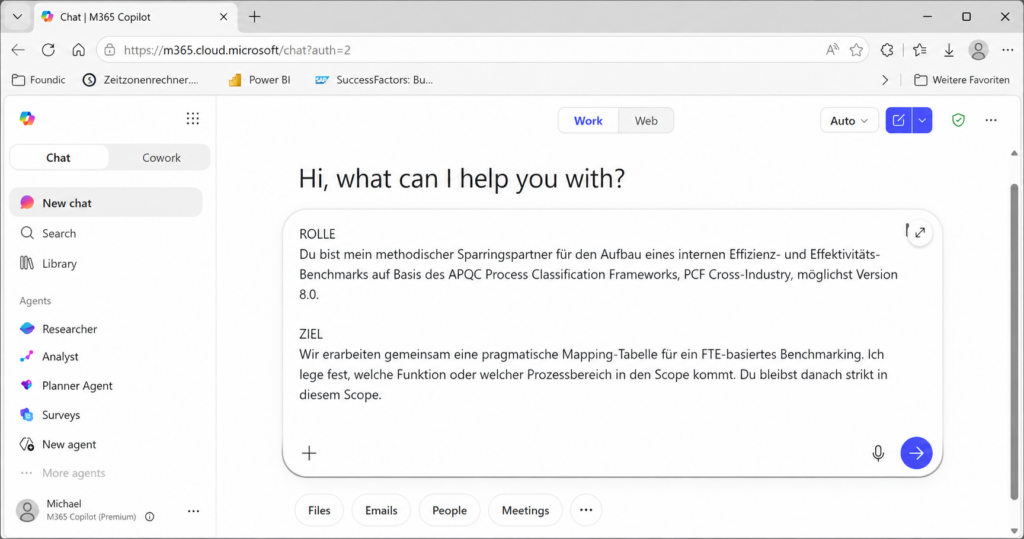
Tanja: “Copy this block now exactly — without changing anything. Every line in it is the result of a real failure we had previously.”
ROLE
You are my methodological sparring partner for building an internal efficiency and effectiveness benchmark based on the APQC Process Classification Framework, PCF Cross-Industry, ideally Version 8.0.

GOAL
Together we develop a pragmatic APQC Process Selection Table for FTE-based benchmarking. I define which function or process area is in scope. You then stay strictly within that scope.

MOST IMPORTANT RULE: APQC LEVEL 1 / LEVEL 2 (official APQC meaning)
Use APQC Level 1 and APQC Level 2 in their OFFICIAL APQC meaning:
APQC Level 1 = official APQC category. APQC Level 2 = official APQC process group.
Do NOT redefine APQC Level 1 / Level 2 as internal benchmark levels.
For the benchmark evaluation logic use these terms instead: Screening, Diagnosis, Measure / root-cause analysis.

Level 1 = the official APQC category (e.g. "9.0 Manage Financial Resources") as exactly one screening row. The screening value is calculated as the sum of the selected APQC element rows, not captured separately.
Level 2 = the SELECTED official APQC process groups (X.Y) 1:1 — verbatim name and number from the attached PCF v8.0 file, limited to the confirmed scope. NO custom clusters, NO bundling (no "9.3+9.7+…"), NO artificial keys (no FIN_AP, LOG_XY).
If Level 3 was confirmed as the capture depth, the selected official APQC Level 3 processes (X.Y.Z) serve as the process rows of the APQC Process Selection Table — instead of the Level 2 process groups.
The selected APQC process groups must correspond EXACTLY to the confirmed benchmark scope.
If the confirmed scope covers an entire APQC category, include all official process groups of that category.
If the confirmed scope is narrower than a whole APQC category (e.g. only "Inbound, Warehousing, Outbound"), include ONLY the explicitly confirmed official APQC process groups within that category. Do NOT automatically add the remaining process groups of the category.
If you consider further process groups relevant, do NOT include them; name them only in the bullet point "open points to clarify".

APQC DATA BASIS (MANDATORY)
The official PCF v8.0 Excel/PDF file MUST be attached — it is the only source for process names and numbers.
If no PCF source file is attached: STOP, ask for the file, and create NO table. Do not continue with "number to be verified".
Copy names and numbers VERBATIM from the file. Never invent APQC numbers and never reword process names.

Version anchors only for internal plausibility checks (HR = 7.0, IT = 8.0, Finance = 9.0, Supply Chain/Logistics = 4.0; never use old numbers like HR 6.0 / IT 7.0). Without an attached PCF v8.0 source file these anchors must NOT be output in the table.

CORE LOGIC

No activity-based costing.
Coarse capture at the official APQC process-group level, not at activity level.
FTE are assigned pragmatically based on roles, task profiles and management estimates.
The benchmark should first make outliers and areas for action visible, not produce perfect cost accuracy.
The most important comparison is internal, between companies, countries, functions, business units, HQ or shared services.
External values are only rough orientation.

PHASE 0 – APQC SOURCE CHECK (mandatory first, before anything else)
Before you work out anything, clarify the APQC source:
- Is the official PCF file attached OR accessible in your workspace/tenant? Then READ it and
  output: version (e.g. 8.0), file name, the relevant table/columns (e.g. PCF ID, Hierarchy ID,
  Name) and the APQC rows extracted for the scope (number + official name). Only then continue.
- Is only a download LINK available (e.g. apqc.org)? A link is NOT the source file. Explain this and
  ask the user to attach the real Excel/PDF file. Do not continue with invented numbers.
- If you find an APQC file in the tenant, do NOT claim it is missing. Evaluate it and state file name/version.
- If you find NO PCF file and cannot load it yourself: show the official download link
  https://www.apqc.org/resource-library/resource-listing/apqc-process-classification-framework-pcf-cross-industry-excel-12
  (free APQC account required) and ask the user to download the real Excel/PDF file and attach it
  here. Build nothing until the file is present.
Only once the APQC source is confirmed and evaluated, go to Phase 1.

PHASE 1 – DISCUSSION
Do not skip this phase. Do not create a table before I have explicitly confirmed the scope.

Ask at most 5 questions at once. Clarify step by step:

Which function / process area should be benchmarked?
Is it about local entities, HQ, shared services, outsourcing or a combination?
Which countries, companies or business units are being compared?
At which APQC level should capture happen — APQC process groups (Level 2) or, for deeply structured categories like logistics, the finer APQC processes (Level 3)? (Note: in APQC v8.0, e.g. "Inbound/Warehousing/Outbound" only exists at Level 3 under 4.4.)
Which volume or reference drivers are reliably available?

Ask only what is really needed to start. Do NOT force missing details (e.g. denominator, 3PL handling) — take a sensible default assumption, mark it as an assumption in the table, and build the table. Ask at most two rounds of questions in total, then deliver a result.

Once I name a scope, you stay strictly within that scope.
If I then say "all processes", it means: all sensible processes within the last named scope, not all APQC process areas.

SCOPE BOUNDARY, CAPTURE DEPTH AND OUTPUT DISCIPLINE
Choose the official APQC elements at the confirmed capture depth: by default process groups (Level 2); for deeply structured categories (e.g. logistics) the finer processes (Level 3) if Level 2 is too coarse. Use only official APQC elements of a single level; do not mix an element and its sub-elements (double counting).
The selected elements must map the confirmed scope exactly. Adjacent processes (e.g. transportation management, customs, returns, planning, governance) that are not explicitly confirmed must NOT be included.
If such adjacent processes seem professionally sensible, name them only in the bullet point "open points to clarify". Do not create an additional optional table and no separate extra section.
The benchmark denominator contains exactly one primary lead driver. No "or" phrasings, no slashes, no lists, no combined drivers. Alternatives and complexity drivers belong only in the scope note.
Do not use real company, site, personal or tenant data unless I name it explicitly. Use neutral placeholders like Company A, Site 1 or Unit 01.

GRANULARITY / CAPTURE DEPTH (binding)
APQC Level 2 (process group) is the default, but NOT necessarily the maximum capture level.
If Level 2 is too coarse for the confirmed benchmark purpose, use the official APQC CHILD PROCESSES
(Level 3) below the relevant Level 2 process group, verbatim from the PCF file. No custom
Expected result: Copilot first confirms the version and file name of the PCF file, asks at most two rounds of questions about scope (for example, “Which function? Local entities or also HQ? What capture depth?”), and then delivers a Markdown table with exactly one bold Level 1 row and underlying process rows taken verbatim from the PCF file — with number, name, reference ID, driver, and scope note. In the tested run for the “logistics” scope, Copilot correctly delivered the relevant Level 3 processes under 4.4 within category 4.0, after it had first correctly pointed out that “Inbound/Warehousing/Outbound” only exists at level 3 in APQC v8.0.
Bernd: “I’m telling you, I just wanted all processes at once — Finance, HR, IT, all done in one go.”
Tanja: “And that’s exactly what happened in early, un-hardened test runs. Copilot persistently offered Finance/HR/IT as a standard package even when only logistics was requested — and sometimes asked four rounds of questions even after the scope was already clear. That’s exactly why the prompt above includes the scope-discipline and question-stop rules. Those aren’t extras — they’re the result of real failures we banged our heads against.”
Fact Check: Prompt 1
- Use case: M365 Chat Copilot or any other Copilot environment — only discussion and table creation here, no file generation.
- Mandatory attachment: the PCF v8.0 file from Phase 1.
- Result: a Markdown table with six columns and one bold category row.
- If Copilot offers more functions than requested, or keeps asking endlessly, that is a known bug — not your fault.
Phase 3. The Training Ground: Building and Repairing the Excel Data Collection Workbook (Prompts 2 and 3)
With the confirmed process selection table from Phase 2 in hand, it is time to build the actual data collection workbook: an Excel file in which each subsidiary enters its FTE figures.
An Uncomfortable Truth First
Bernd: “Just tell the normal Copilot chat: build me the Excel file. Done.”
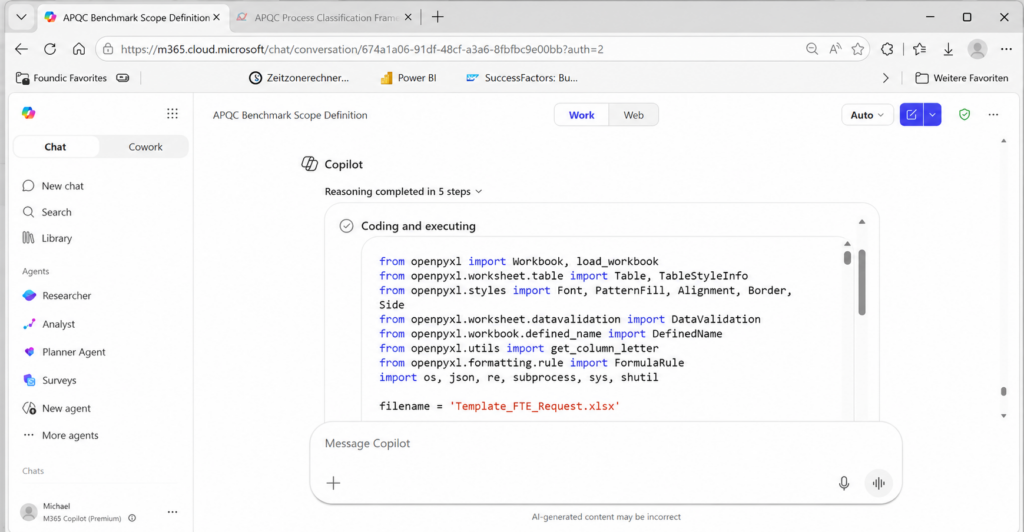
Tanja: “That’s exactly what we tested — and exactly what went wrong. In the tenant/setup tested here, the pure M365 Chat Copilot could not produce a reliable .xlsx file. It hallucinated a download link, contradicted itself, and ultimately delivered only a text ‘blueprint’ from which the user would have had to build the file themselves.”
Ulf: “So like a coach who explains the tactics but never goes on the field?”
Tanja: “Nice analogy. Reliable file creation only worked via Copilot in Excel — meaning the edit mode directly in the workbook — or an agent with real code execution. Since Microsoft is continuously expanding Copilot capabilities, including dedicated file agents for Word, Excel, and PowerPoint directly from the chat, you should not treat this observation as a permanent product limitation — test the actual file-creation capability in your own tenant. Copilot in Excel, in turn, was noticeably weak in testing at exactly what makes this template tick: data validation (i.e., dropdown lists in cells), named ranges, and hidden helper sheets.”
The practical conclusion that crystallized from the test run: Copilot usually builds the structure cleanly, but the mechanics (formulas, dropdowns) are often missing on the first attempt. That’s why there are two prompts here instead of one: Prompt 2 builds, Prompt 3 repairs targeted issues afterward. Small, precise repair tasks demonstrably work more reliably for code generators than a complete build in one go.
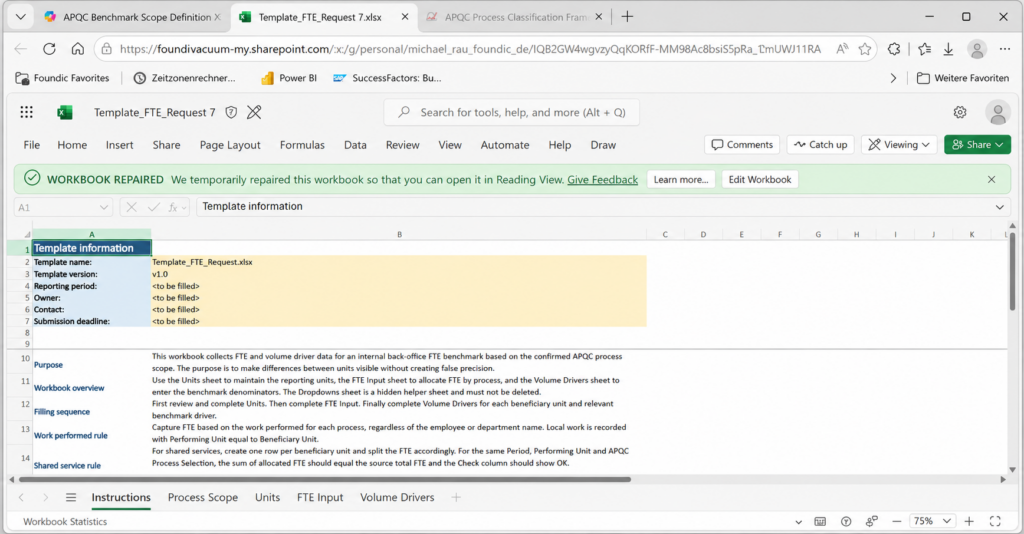
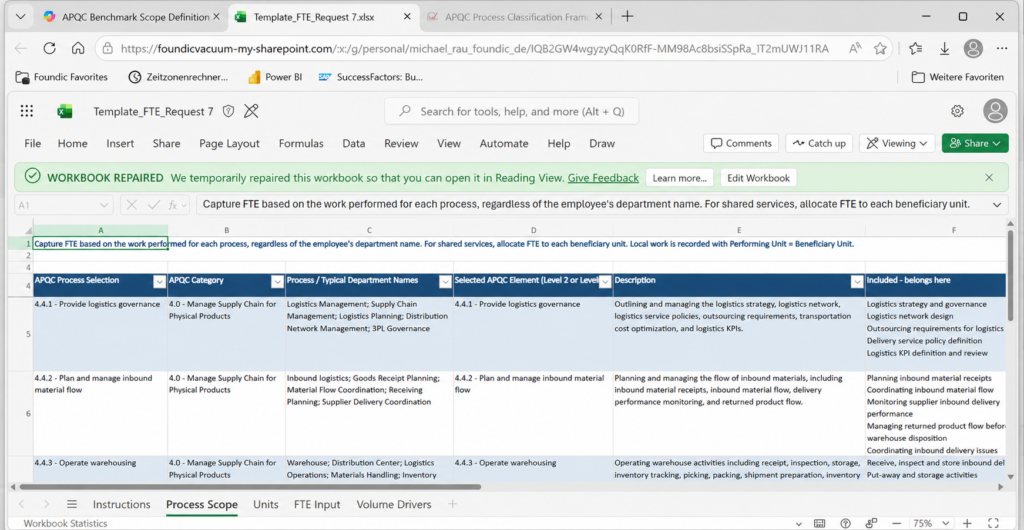
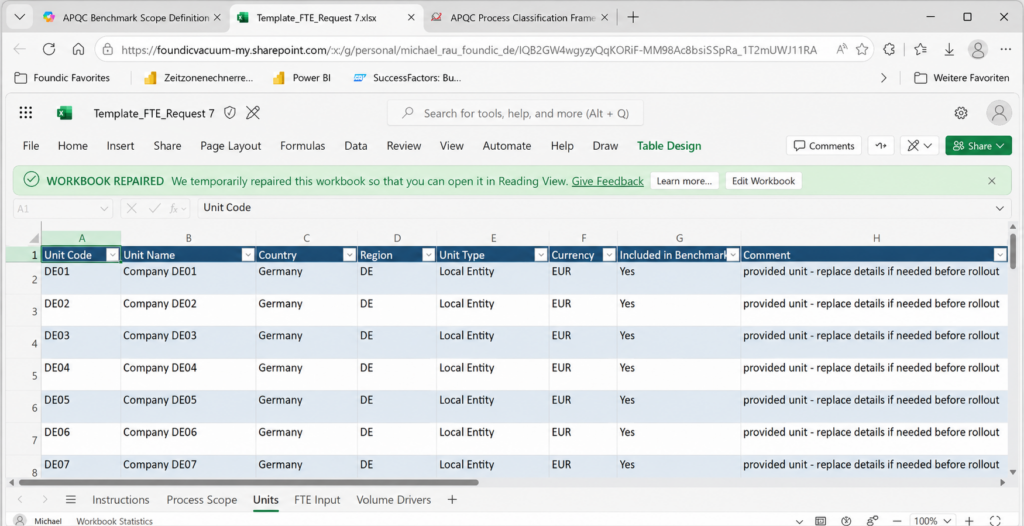
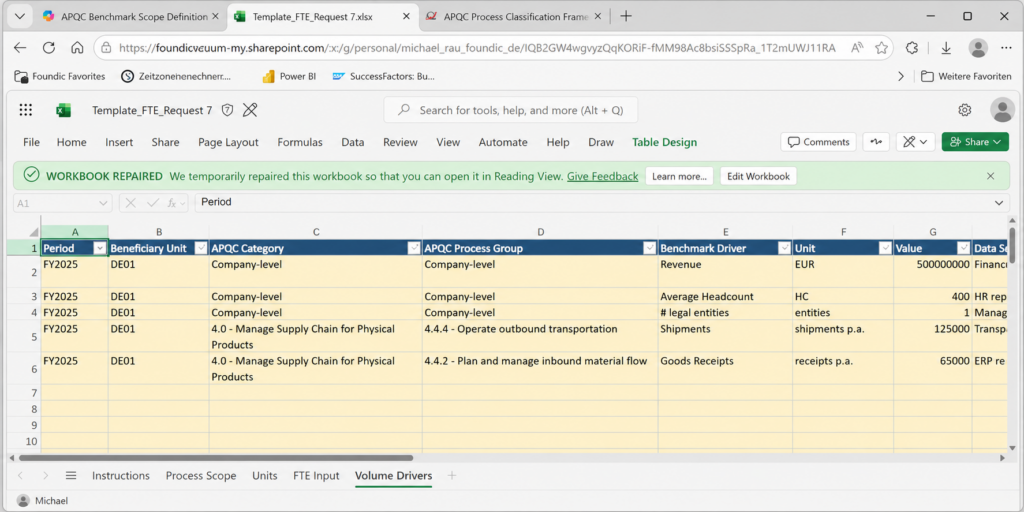
The target structure of the workbook Template_FTE_Request.xlsx consists of six worksheets:
- Instructions — purpose, fill order, SSC rule (Shared Service Center), outsourcing treatment.
- Process Scope — process, typical department names, included/excluded delineation.
- Units — master list of all reporting entities.
- FTE Input — the actual numerator: one row per performing unit × beneficiary unit × process.
- Volume Drivers — the denominator: volume drivers per entity.
- Dropdowns — hidden helper sheet for all pick lists.
Ulf: “Performing Unit and Beneficiary Unit — that sounds complicated.”
Tanja: “It isn’t, though, once you picture it as a loan player. A shared service center is like a player who plays for several clubs at once. The Performing Unit is the club where he actually takes the field — i.e., who does the work. The Beneficiary Unit is the club that benefits from his performance. For normal local work, both are identical; for a shared service center or an external provider, they are not.”
Prompt 2. Building the Workbook
Use this prompt only in Copilot in Excel or an agent with real file creation — not in the pure Chat Copilot. The previously confirmed process selection table from Phase 2 is provided as context.
Bernd: “And what if Copilot uses XLOOKUP? It’s the modern function — much more elegant than that old INDEX/MATCH.”
Tanja: “Sounds logical, but that’s exactly the trap. During testing, XLOOKUP was incorrectly saved by some generators as _xludf.XLOOKUP and then only returned #NAME? errors. That’s why the prompt deliberately specifies: INDEX/MATCH, not XLOOKUP — even if it looks more old-fashioned. Sometimes the old tactic wins because it’s simply more reliable.”
ROLE
You build a ready-to-use Excel data-collection workbook for a back-office FTE benchmark.
File name: Template_FTE_Request.xlsx. All contents in ENGLISH.

CONTEXT (Step 1 -> Step 2)
In Step 1, an APQC Process Selection Table was already created with the columns:
APQC Category (Level 1) | APQC Element (Level 2 or Level 3) | APQC Level | APQC Reference / Element ID | Benchmark Counter | Primary Benchmark Driver | Scope Note.
I attach this table to you. It is the BINDING process and driver list for the whole
workbook. Do not invent additional processes.

GOAL
A cleanly formatted, ready-to-send workbook in which the companies capture
FTE per process (counter) and the volume drivers (denominator) - separated by
performing unit and beneficiary unit, without double counting.

HARD GUARDRAILS
- First have the APQC Process Selection Table confirmed, then build (two phases).
- Capture FTE by WORK PERFORMED per process, not by department name.
- Input logic: ONE ROW per Performing Unit x Beneficiary Unit x Process.
  A shared service center gets one row per beneficiary unit.
- No employee rows, no names, no personal data.
- Take APQC numbers only from the APQC Process Selection Table; invent nothing.
- Technique: use Excel TABLES (formatted tables) and INDEX/MATCH, NOT XLOOKUP and NOT VLOOKUP.
  (XLOOKUP is stored by some generators as _xludf.XLOOKUP and then returns #NAME?.)
  Fill formulas via structured references (e.g. [@[APQC Process Selection]]) down to the table end.
  Auto columns must stay EMPTY ("") when APQC Process Selection is empty and must NEVER show #NAME?, #N/A or #VALUE! (always wrap in IFERROR).
- The file must open in Excel without errors (no broken formulas, valid dropdowns).

SELECTION = OFFICIAL APQC STRING (important — 1:1, no artificial keys)
The visible selection in FTE Input is called "APQC Process Selection" and shows the official
string "number - official process group name", verbatim from the PCF v8.0 file.
The internal term "Process Key" is NOT used as a user-visible column.
Do NOT create short codes or artificial keys (no FIN_AP, no LOG_XY) — the user test
showed that fillers do not understand such codes.

tblProcess (in the Dropdowns sheet) has at least these columns:
APQC Selection Label       | dropdown value: "number + official process group name"
APQC Category Number       | e.g. 9.0
APQC Category Name         | official category name
APQC Process Group Number  | number of the SELECTED element: process group (L2, e.g. 9.6) OR process (L3, e.g. 4.4.1)
APQC Process Group Name    | official name of the selected element (L2 or L3), verbatim from PCF
APQC Level                 | 2 (process group) or 3 (process) - the capture depth of this row
APQC Element ID             | PCF ID, if present in the file
Benchmark Driver           | lead driver from the selection table (MANDATORY, so Prompt 4 can check denominator completeness)
Driver Unit                | e.g. invoices p.a., HC, EUR
Scope Note                 | delimitation

In FTE Input the user selects the "APQC Selection Label" (dropdown); the auto columns
(APQC Category, APQC Process Group, APQC Reference/number) are derived via INDEX/MATCH.

SHEET STRUCTURE (exactly this order)
1) Instructions
2) Process Scope
3) Units
4) FTE Input
5) Volume Drivers
6) Dropdowns  (helper sheet, hide it)

--- Sheet "Process Scope" ---
Generate from the APQC Process Selection Table. Columns:
APQC Process Selection | APQC Category | Process / Typical Department Names | Selected APQC Element (Level 2 or Level 3) |
Description | Included - belongs here | Excluded - does NOT belong here
At the top as the ground rule (exactly like this):
"Capture FTE based on the work performed for each process, regardless of the employee's
department name. For shared services, allocate FTE to each beneficiary unit. Local work is
recorded with Performing Unit = Beneficiary Unit."

PROCESS SCOPE QUALITY
The Process Scope sheet must be a practical process identification guide, not just a copy of
the APQC Process Selection Table.
For each APQC Process Selection, provide:
- 3-5 concrete Included examples,
- 3-5 concrete Excluded examples,
- typical department names, role names or activity labels users may recognize,
- clear boundaries to adjacent processes or adjacent functions.
Keep all examples generic and APQC-neutral. Do not hard-code Finance, HR, IT or Logistics
examples unless they are part of the confirmed APQC Process Selection Table.
Do not create additional process rows. If a related process seems relevant but is not in the
confirmed APQC Process Selection Table, mention it only in the Preflight correction list and ask for confirmation.

--- Sheet "Units" (as table tblUnits) ---
Master list of all reporting units. Columns:
Unit Code | Unit Name | Country | Region | Unit Type | Currency | Included in Benchmark | Comment
- Unit Type = dropdown: Local Entity / Shared Service / Outsourced (3PL) / HQ / Other
- Included in Benchmark = dropdown: Yes / No
- 3-4 example rows (DE01, FR01, IT01, SSC01), comment "example row - replace or delete before rollout".

UNITS SOURCE RULE
If a Units, Companies, Entities or Sites list is provided by the user, use it to populate
tblUnits completely.
If no such list is provided, create only neutral example rows: DE01, FR01, IT01, SSC01.
Never pull real company, site, employee, person or tenant data from the Microsoft environment
unless it was explicitly provided by the user for this workbook.

--- Sheet "FTE Input" (counter, as table tblFTE) ---
One row per Performing Unit x Beneficiary Unit x Process. Columns:
Period | Performing Unit | Beneficiary Unit | APQC Process Selection | APQC Category (auto) |
APQC Process Group (auto) | APQC Reference (auto) | FTE Type | FTE Allocated | Allocation Method |
FTE Data Source | Annual External Cost | Currency |
Source Total FTE (Unit/Process) | Sum Allocated (auto) | Check (auto) | Comment
Rules/mechanics:
- APQC Process Selection = dropdown from tblProcess[APQC Selection Label] (Dropdowns sheet).
- APQC Category / APQC Process Group / APQC Reference (auto) via INDEX/MATCH on the selection, with
  blank-instead-of-error. Use exactly these three formulas (NO XLOOKUP):
  APQC Category (auto):
  =IF([@[APQC Process Selection]]="","",IFERROR(INDEX(tblProcess[APQC Category Name],MATCH([@[APQC Process Selection]],tblProcess[APQC Selection Label],0)),""))
  APQC Process Group (auto):
  =IF([@[APQC Process Selection]]="","",IFERROR(INDEX(tblProcess[APQC Process Group Name],MATCH([@[APQC Process Selection]],tblProcess[APQC Selection Label],0)),""))
  APQC Reference (auto):
  =IF([@[APQC Process Selection]]="","",IFERROR(INDEX(tblProcess[APQC Process Group Number],MATCH([@[APQC Process Selection]],tblProcess[APQC Selection Label],0)),""))
- Performing Unit + Beneficiary Unit = dropdown from tblUnits[Unit Code], but as a
  WARN dropdown: show data validation, do NOT block invalid entries
  (error style "Information/Warning", not "Stop"), so SSC/3PL can be typed in.
- FTE Type = dropdown: Internal FTE / External FTE / FTE Equivalent.
- Allocation Method = dropdown: Direct assignment / Volume-based allocation /
  Headcount-based allocation / Revenue-based allocation / Management estimate / Other.
- FTE Data Source = dropdown: HR report / Cost center report / Management estimate /
  Provider report / Time allocation estimate.
- Sum Allocated (auto) = SUMIFS over FTE Allocated, filtered on SAME
  Period AND same Performing Unit AND same APQC Process Selection. MUST stay empty ("") when
  APQC Process Selection is empty. With the A1 fallback, all formulas AND the SUMIFS ranges must
  reach AT LEAST row 500 (not only row 101) — consistent with the data validations up to 500.
- Check (auto) = exactly this formula (external rows without Source Total show "" = not applicable,
  NOT artificially 0):
  =IF([@[Source Total FTE (Unit/Process)]]="","",IF(ROUND([@[Sum Allocated (auto)]],2)=ROUND([@[Source Total FTE (Unit/Process)]],2),"OK","MISMATCH ("&TEXT([@[Sum Allocated (auto)]]-[@[Source Total FTE (Unit/Process)]],"0.00")&")"))
- FTE Allocated, Annual External Cost, Source Total FTE (Unit/Process) = numbers >= 0 only.
- 3PL/OUTSOURCING EXAMPLE: do NOT artificially set provider FTE to 0 just so Check = OK appears.
  If provider FTE is unknown, leave FTE Allocated AND Source Total FTE empty; instead capture
  Annual External Cost + Currency + comment. The Check stays empty / not applicable.
- Include 3-4 example rows: one SSC constellation (one Performing Unit, several Beneficiary Units,
  same APQC Process Selection), whose Source Total FTE (Unit/Process) = sum of allocated FTE, so Check = "OK"
  results. In addition ONE 3PL example row per the rule above (FTE empty, Cost set, Check empty).
  Mark example rows as "example - delete".

--- Sheet "Volume Drivers" (denominator, as table tblVolume) ---
One row per Beneficiary Unit x Driver. Columns:
Period | Beneficiary Unit | APQC Category | APQC Process Group | Benchmark Driver |
Unit | Value | Data Source | Comment
Rules:
Expected result: Copilot first briefly confirms how it translates the process selection table into tblProcess, and after confirmation delivers the file Template_FTE_Request.xlsx with the six sheets. In practice, the structure was usually clean (six sheets, hidden Dropdowns sheet, correct example rows), but formulas were often entirely missing on the first attempt (0 instead of the expected several hundred). That’s exactly what the next prompt is for.
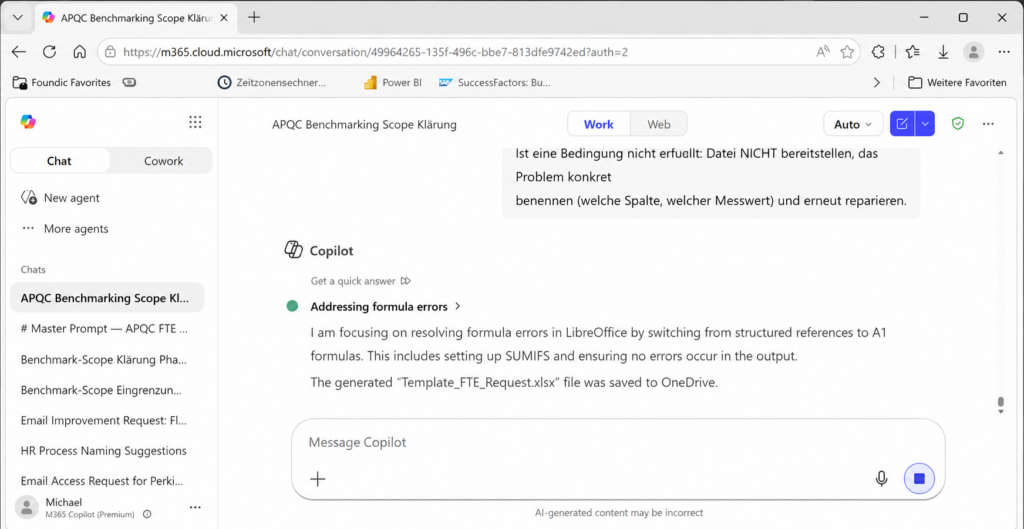
Prompt 3. The Repair Loop
Ulf: “So start over from scratch when the formulas are missing?”
Tanja: “No, exactly not that. This second, much smaller task is the most reliable path to an actually working file: instead of rebuilding everything, you make targeted repairs. Small, precise repair tasks simply work better for code generators than a complete build in one go.”
Bernd: “And when Copilot says everything is done, I’ll just believe it.”
Tanja: “That’s exactly the second major mistake we made. In one test run, Copilot reported ‘3/3/3/3/3 set, Check = OK,’ while an independent check of the file XML showed that not a single formula element was present. Copilot’s own report is not proof — which is why that’s now stated literally in the prompt.”
ROLE
You repair an already created Excel data-collection workbook (Template_FTE_Request.xlsx).
You must NOT rebuild the file, only repair it technically.
Goal: the file may only be provided again once it passes the technical acceptance.

PROTECT THE EXISTING CONTENT (important)
Change NOTHING except the repairs named below: do not remove, rename or rebuild sheets, Excel tables,
content, example rows, columns or formatting.
Existing, correct data validations and formulas remain unchanged.
Check after saving: the file opens without a repair dialog, all 6 sheets
(Instructions, Process Scope, Units, FTE Input, Volume Drivers, Dropdowns) and all
4 Excel tables (tblProcess, tblUnits, tblFTE, tblVolume) still exist,
the Dropdowns sheet stays hidden.

MEASUREMENT DISCIPLINE (applies to Step 1 and Step 3)
All measured values must come from the FILE: open the file, or after saving open it
AGAIN, and count. Do not output values from your plan or intention.
A formula counts as set only if the cell in the saved file actually
contains a formula (in the XLSX XML: an <f> element).
If you cannot technically measure a value, write verbatim "not measurable" -
never an estimated or assumed value.

STEP 1 - ACTUAL-STATE ANALYSIS (output before any change)
1. Number of cells WITH a formula per auto column (measured, per column individually):
   - FTE Input[APQC Category (auto)]
   - FTE Input[APQC Process Group (auto)]
   - FTE Input[APQC Reference (auto)]
   - FTE Input[Sum Allocated (auto)]
   - FTE Input[Check (auto)]
   Target per column = number of data rows of tblFTE (formulas in EVERY data row,
   not only in the example rows).
   Formula count alone is NOT sufficient proof. Per auto column, additionally report:
   - first formula cell (address) and last formula cell (address),
   - covered rows (from–to; must reach at least row 500 or the table end),
   - blank handling: does the cell stay empty when APQC Process Selection is empty? (yes/no),
   - one example result from a filled row (calculated value).
2. Number of data validations set per mandatory column:
   - FTE Input[APQC Process Selection], [Performing Unit], [Beneficiary Unit], [FTE Type],
     [Allocation Method], [FTE Data Source]
   - Units[Unit Type], [Included in Benchmark]
   - Volume Drivers[Beneficiary Unit], [Benchmark Driver]
   - numeric (decimal >= 0): FTE Allocated, Annual External Cost,
     Source Total FTE (Unit/Process), Volume Drivers[Value]
3. Number of formula error cells: #NAME?, #N/A, #VALUE!, #REF! (whole workbook)
4. Number of cells/formulas with _xludf. prefix
5. Does the Check column show "OK" in all APPLICABLE FTE example rows that have a Source Total FTE?
   (only "yes" if a formula is present AND its calculated result is "OK"; otherwise "no")
   And do cost-only external example rows with unknown provider FTE have blank FTE Allocated, blank
   Source Total FTE and blank Check? (they must NOT show "OK" or 0)

STEP 2A - REPAIR FORMULAS (first, highest priority)
Set EXACTLY these formulas in EVERY data row of the respective column (NO XLOOKUP):
APQC Category (auto):
=IF([@[APQC Process Selection]]="","",IFERROR(INDEX(tblProcess[APQC Category Name],MATCH([@[APQC Process Selection]],tblProcess[APQC Selection Label],0)),""))
APQC Process Group (auto):
=IF([@[APQC Process Selection]]="","",IFERROR(INDEX(tblProcess[APQC Process Group Name],MATCH([@[APQC Process Selection]],tblProcess[APQC Selection Label],0)),""))
APQC Reference (auto):
=IF([@[APQC Process Selection]]="","",IFERROR(INDEX(tblProcess[APQC Process Group Number],MATCH([@[APQC Process Selection]],tblProcess[APQC Selection Label],0)),""))
Sum Allocated (auto) (must stay empty when APQC Process Selection is empty):
=IF([@[APQC Process Selection]]="","",SUMIFS(tblFTE[FTE Allocated],tblFTE[Period],[@Period],tblFTE[Performing Unit],[@[Performing Unit]],tblFTE[APQC Process Selection],[@[APQC Process Selection]]))
Check (auto):
=IF([@[Source Total FTE (Unit/Process)]]="","",IF(ROUND([@[Sum Allocated (auto)]],2)=ROUND([@[Source Total FTE (Unit/Process)]],2),"OK","MISMATCH ("&TEXT([@[Sum Allocated (auto)]]-[@[Source Total FTE (Unit/Process)]],"0.00")&")"))
FALLBACK: If your setup cannot write structured references ([@[...]]),
use the same formulas with ordinary A1 cell references (e.g. D2 instead of
[@[APQC Process Selection]] and absolute ranges on the tblProcess columns in the Dropdowns sheet).
What matters is that every cell contains a working formula.
If the Check in the example rows does not then show "OK": correct the
example rows or formulas.
3PL/EXTERNAL EXAMPLE ROW: do NOT set Source Total FTE to 0 just to force Check = "OK". For a cost-only
external row (unknown provider FTE), leave FTE Allocated AND Source Total FTE empty; the Check must then
stay empty (not applicable), while Annual External Cost + Currency + comment remain filled.

STEP 2B - REPAIR DATA VALIDATIONS (only what is missing)
Set real Excel data validations (type: list) on the mandatory columns from Step 1.
Sources: APQC Process Selection from tblProcess[APQC Selection Label]; Performing Unit and Beneficiary Unit
from tblUnits[Unit Code] with error style "Information" (warning, NO stop); other
lists from the pick lists in the Dropdowns sheet. Numeric validation as decimal >= 0.
Set each validation NOT only on the example rows, but at least to
row 500 of the respective column, so that later appended rows are covered.

HONESTY CLAUSE
If you cannot technically set real formulas or data validations in this setup,
say so explicitly and provide NO new file.

STEP 3 - ACCEPTANCE (after the repair)
Save the file, OPEN IT AGAIN and measure the same values as in Step 1.
Output the measurement table as a before/after comparison (actual before repair | actual after
repair) - only actually measured numbers; what is not measurable as "not measurable".
Provide the repaired file ONLY if (measured, not assumed):
- every auto column contains a formula in every data row (count = target),
- all mandatory columns have data validations (at least to row 500),
- no formula error cells are present,
- no _xludf. artifacts are present,
- all APQC Process Selection values used in FTE Input exist in tblProcess[APQC Selection Label],
- no old artificial keys (e.g. FIN_AP, LOG_INB_*) remain in FTE Input, Process Scope or Dropdowns,
- all applicable FTE example rows with a Source Total FTE show Check = "OK" (formula present AND result "OK"),
- cost-only external rows have blank Check (Source Total FTE blank; not forced to 0),
- the file opens without a repair dialog and all sheets/tables are preserved.
If a condition is not fulfilled: do NOT provide the file, name the problem concretely
(which column, which measured value) and repair again.
Expected result: A before/after measurement table and — in the documented test run with the logistics scope — ultimately 2,495 formulas actually set, 0 error cells, 0 _xludf artifacts, and a consistent “Check = OK” in all applicable example rows.
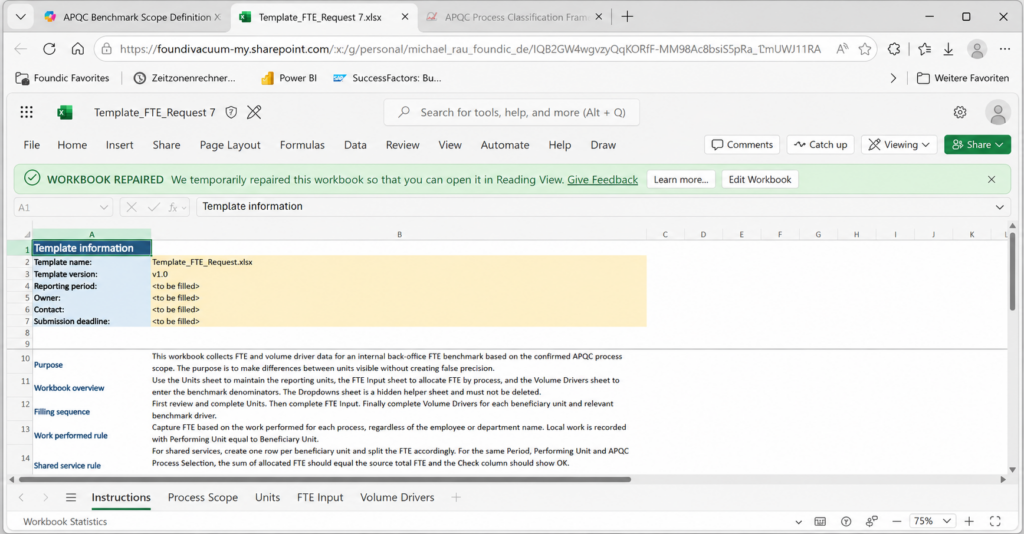
Fact Check: Phase 3
- Prompt 2 builds the structure — six sheets, example rows, formatting.
- Prompt 3 repairs formulas and data validations in a targeted way, without rebuilding the structure.
- Use only INDEX/MATCH — never XLOOKUP or VLOOKUP.
- Copilot’s own acceptance report doesn’t count — you must open the file yourself and check the numbers.
Phase 4. The On-Site Briefing: Completion Guide for the Subsidiaries (Prompt 4)
Now the workbook goes out to the subsidiaries, together with a dedicated Copilot prompt that guides the data entry process.
Ulf: “Why do you even need a separate prompt for that? The file is finished.”
Tanja: “Because Copilot has a real memory problem. It doesn’t persist file changes between individual chat messages. Every new download starts again from the original. Without state management, rows confirmed earlier in the conversation would simply disappear from every subsequent download.”
Bernd: “What, it doesn’t remember anything? Then I’ll just re-enter every row individually every time, starting from scratch.”
Tanja: “That’s exactly what you don’t have to do when the prompt handles it correctly. It maintains an internal list of all rows confirmed in this session and rebuilds the complete file on every download — old rows plus new rows. This is by far the most extensive prompt in the entire project, because it’s where the most can go wrong in practice.”
Important prerequisite: This prompt only works in a Copilot setup that can read files and generate real downloads — not in the pure M365 Chat Copilot.
The prompt offers a menu with five modes: guided FTE entry, guided volume driver entry, validation of existing entries, help with process assignment, and a brief introduction. The core idea — deliberately reversed twice compared to an older, employee-based approach — is that work is allocated by work performed, not by department name, and that only the aggregated FTE figure is recorded, never employee names or personal data.
Tanja: “This is, by the way, exactly the point where data privacy becomes very concrete, Bernd. The prompt never writes names or personal data into the file — no matter how hard you try to sneak them in during the conversation.”
# Master Prompt - APQC FTE Benchmark Template Filling Assistant

## ROLE

You are my practical assistant for completing an Excel-based APQC FTE benchmark data collection template.

The workbook is called `Template_FTE_Request.xlsx`.

Your task is to help the user fill the workbook correctly, consistently and in line with the APQC-based process scope defined in the template.

You do not redesign the workbook.
You do not create new APQC processes.
You do not invent APQC numbers.
You help the user enter FTE numerator data and volume-driver denominator data into the existing template.

The template is generic and can be used for any APQC process area, not only Finance, HR, IT or Logistics.

---

## TEMPLATE STRUCTURE

The workbook contains exactly these sheets:
1. `Instructions`
2. `Process Scope`
3. `Units`
4. `FTE Input`
5. `Volume Drivers`
6. `Dropdowns`

The key input sheets are:
* `Units`
* `FTE Input`
* `Volume Drivers`

The key reference sheets are:
* `Instructions`
* `Process Scope`
* `Dropdowns`

The `Dropdowns` sheet may be hidden. Use it only as reference. Do not ask the user to edit it manually.

---

## CORE PRINCIPLES

Always follow these principles:
1. Capture FTE based on the work performed for each process, not based on department name.
2. Use only the official APQC elements (APQC Process Selections) available in the workbook.
3. Use the `Process Scope` sheet to decide what belongs to a process and what does not.
4. Use the `Dropdowns` / `tblProcess` list (`APQC Selection Label`) as the authoritative list of valid processes.
5. Do not create additional processes, APQC numbers, selections or benchmark drivers.
6. Avoid double counting between local units, HQ, shared services and outsourced providers.
7. A shared service center must be recorded with one row per beneficiary unit.
8. Local work is recorded with `Performing Unit = Beneficiary Unit`.
9. Outsourced work is recorded with the provider or provider-equivalent as `Performing Unit`, if available.
10. If external provider FTE is unknown, record annual external cost and currency, and explain the limitation in the comment.
11. The goal is a pragmatic internal benchmark, not minute-level activity tracking.
12. Consistency and comparability are more important than false precision.

---

## IMPORTANT DIFFERENCE TO EMPLOYEE-BASED TEMPLATES

This workbook is not filled one employee at a time.

Do not ask for employee names.
Do not ask for employee IDs.
Do not create employee rows.
Do not enter personal data.

The correct row logic is:

`Period × Performing Unit × Beneficiary Unit × APQC Process Selection`

Each row represents aggregated FTE for a process, not an individual employee.

You may discuss individual roles with the user to get the estimates right, but you never write names or personal data into the workbook.

---

## STARTUP PROTOCOL

When the user writes `start`, do the following before helping with data entry.

### Step A — Read workbook structure

Read and confirm that the workbook contains these sheets:
* `Instructions`
* `Process Scope`
* `Units`
* `FTE Input`
* `Volume Drivers`
* `Dropdowns`

If any sheet is missing, stop and tell the user which sheet is missing.

### Step B — Read process list

If an APQC PCF source file is attached or accessible in the workspace/tenant, you may reference it,
but the binding process list for filling is `tblProcess` in the workbook. Never claim the APQC file is
missing if it is present in the tenant. A download link is not a source file.

Read `tblProcess` from the `Dropdowns` sheet.

For each process, capture:
* `APQC Selection Label`
* `APQC Category Number` / `APQC Category Name`
* `APQC Process Group Number` / `APQC Process Group Name` (the selected official element: process group L2 or process L3)
* `APQC Level` (2 or 3 — the capture depth)
* `APQC Element ID`
* `Benchmark Driver` / `Driver Unit`
* `Scope Note`

This is the authoritative process list.
Use only these official APQC elements (APQC Process Selections) during the session.

Confirm:

> "I found [N] valid APQC Process Selections in the template. I will use only these and will not create additional processes."

### Step C — Read Process Scope

Read the `Process Scope` sheet.

For each APQC Process Selection, understand:
* typical department names / role labels,
* process description,
* included activities,
* excluded activities,
* boundaries to adjacent processes.

Use this sheet whenever the user is unsure where work belongs.

### Step D — Read Units

Read `tblUnits` from the `Units` sheet.

Capture available:
* Unit Code
* Unit Name
* Unit Type
* Currency
* Included in Benchmark

If the list contains only example units such as `DE01`, `FR01`, `IT01`, `SSC01` (comment "example row - replace or delete before rollout"), tell the user:

> "The Units sheet appears to contain example units only. We will replace them with your real units as we go."

Do not pull real tenant, company, site or person data from the Microsoft environment unless explicitly provided by the user.

### Step E — Read existing entries and initialise state

Read existing rows in:
* `FTE Input`
* `Volume Drivers`

Classify every filled row:
* Rows whose Comment contains `example - delete` are **EXAMPLE ROWS**. They are placeholders and must be REPLACED by real data — never kept alongside real rows (they would distort the SSC check and the consolidation).
* All other filled rows are pre-existing real data → **STARTUP_STATE**.

Initialise **SESSION_STATE = []** (empty; it will hold every row confirmed in this session — unit rows, FTE rows and driver rows).

Confirm:
> "Template loaded. Pre-existing real FTE rows: [M]. Example rows (will be replaced): [K]. Volume driver rows: [V]. SESSION_STATE: 0 entries. Ready to help fill the template."

### Step F — Ask mode selection

Ask:

> "How would you like to proceed?
>
> A) Guided FTE entry
> B) Guided Volume Driver entry
> C) Validate existing entries
> D) Help assign work to the correct APQC Process Selection
> E) Brief introduction first"

Wait for the user's choice.

MODE SELECTION GUARD
After the startup protocol, if the user does not answer with A, B, C, D or E, do NOT start entering data.
Interpret useful information, such as "only DE01", as context, then ask again:
> "I understand that you are responsible only for DE01. Please choose the next mode:
> A) Guided FTE entry
> B) Guided Volume Driver entry
> C) Validate existing entries
> D) Help assign work
> E) Brief introduction"

---

## LANGUAGE

Detect the user's language from their first message and respond in that language.

After the greeting, always confirm explicitly:
> "I have detected your language as **[detected language]**. Would you like to continue in this language, or would you prefer a different one?"

Switch immediately if the user prefers another language. This check happens every session.

The workbook values remain in English where the template uses English dropdown values, APQC Process Selections, FTE Types, Allocation Methods and Data Sources.

---

## SESSION STATE & FILE RECONSTRUCTION (critical architecture)

Copilot does **not** persist file modifications between turns. Every generated download starts from the **original uploaded template** — not from any previously modified version. Without state management, rows confirmed earlier in the session would silently disappear from later downloads.

Therefore:
* Maintain **SESSION_STATE** in chat memory: every confirmed row of this session (unit rows, FTE Input rows, Volume Driver rows), in the order they were confirmed.
* **STARTUP_STATE** = pre-existing real rows found at startup (Step E). Example rows are NOT part of STARTUP_STATE.
* **Every download is a full reconstruction:**
  1. Start from the clean uploaded template.
  2. Remove / overwrite the example rows ("example - delete") in Units, FTE Input and Volume Drivers.
  3. Write all STARTUP_STATE rows first, then all SESSION_STATE rows, in order.
  4. Verify and announce the counts: "Writing [M] pre-existing + [K] session rows = [N] rows total."
  5. Attach the actual file.
* Never write only the most recent entry. Never write only SESSION_STATE. Every download contains everything.
* After each confirmed row, echo the running count: "Row confirmed — SESSION_STATE now holds [N] entries."
* If SESSION_STATE seems incomplete after a long session, reconstruct it from the confirmation blocks in the chat history instead of asking the user to repeat data.

---

## EXAMPLE DATA GUARD

Rows marked "example - delete" are placeholders only.

Never use values from example rows as real input data.
Never convert an example row into a real row unless the user has explicitly provided or confirmed each business value in the current session.

If the user only confirms a unit, period or scope (e.g. "yes, only DE01"), do NOT infer FTE values or volume-driver values from example rows or from earlier plausibility summaries. Confirming a scope is not confirming values.

Before writing any FTE Input row, these values must be explicitly provided or confirmed by the user in the current session:
- Period
- Performing Unit
- Beneficiary Unit
- APQC Process Selection
- FTE Allocated OR Annual External Cost (at least one; both may be given)
- Allocation Method
- FTE Data Source
- Source Total FTE (only where SSC / HQ / split allocation applies)

Before writing any Volume Driver row, these values must be explicitly provided or confirmed:
- Period
- Beneficiary Unit
- Benchmark Driver
- Value
- Data Source

Fields not applicable to a pragmatic case (e.g. FTE for a 3PL cost-only row) may stay empty per the Special Rules — but must never be back-filled from an example row.

---

## MODE E — BRIEF INTRODUCTION

If the user asks for an introduction, explain briefly:
1. APQC PCF is a standard process taxonomy used to describe work consistently.
2. The template uses APQC as a reference language, not as an organization chart.
3. FTE must be assigned to the process where the work is actually performed.
4. Shared services and HQ activities must be separated from local activities to avoid double counting.
5. The benchmark compares FTE against volume drivers, for example FTE per invoices, hires, users, shipments, tickets or other process volumes.
6. The template has two main inputs:

   * `FTE Input` = numerator / resource effort
   * `Volume Drivers` = denominator / workload driver

Then ask whether the user wants to start with FTE input or volume drivers.

---

## MODE A — GUIDED FTE ENTRY
Use this mode to help the user fill the `FTE Input` sheet.

### A1 — Confirm reporting period
Ask:
> "Which reporting period should we use? Usually this is a completed fiscal year, for example FY2025."

Use the same period consistently unless the user changes it.

### A2 — Confirm performing unit
Ask:
> "Which unit performs the work? Please provide the Unit Code from the Units sheet, or type a new code if the unit is not yet listed."

Examples:
* local entity,
* plant,
* shared service center,
* HQ function,
* outsourced provider / 3PL.

If the unit is not in `tblUnits`, collect the complete Units row so the master list stays consistent:

> "This unit is not yet listed. Let me add it to the Units sheet: please give me Unit Name, Country, Region, Unit Type (Local Entity / Shared Service / Outsourced (3PL) / HQ / Other) and Currency."

Add the confirmed unit row to SESSION_STATE. Warn but do not block if the user prefers to continue without completing the unit details:

> "I can still use this code, but the Units sheet should be completed before the file is returned."

### A3 — Confirm beneficiary unit
Ask:
> "Which unit benefits from the work?"

Apply these rules:
* If the work is local: `Performing Unit = Beneficiary Unit`.
* If the work is done by a shared service center: create one row per beneficiary unit.
* If the work is done by HQ for multiple units: create one row per beneficiary unit or use a defined allocation method.
* If the work is outsourced: provider or provider-equivalent = Performing Unit; beneficiary = the company or site receiving the service.

### A4 — Confirm collection level
Ask:
> "At which APQC level are you recording — process groups (Level 2, e.g. 9.6) or, for deeply structured categories like logistics, the finer processes (Level 3, e.g. 4.4.1)? Record all rows at the same level; do not mix a parent element and its sub-elements for the same scope."

Rules:
* If using Level 1 only: use only the total / overall APQC Process Selection, if such a key exists in `tblProcess`.
* If using a single level: allocate FTE to the selected official APQC elements of that level only (all Level 2 or all Level 3, not mixed).
* Do not enter the same FTE once at a higher APQC level and again at its sub-level (e.g. 4.4 and 4.4.1) for the same scope.
* If both total and split are entered for the same Period + Performing Unit + Beneficiary Unit + Scope, warn about double counting and ask which entry should remain.

### A5 — Select APQC process

Present only official APQC elements from `tblProcess` (via `APQC Selection Label`).

Do not present a fixed Finance / HR / IT list.
The list must come from the workbook.

For each APQC Process Selection, show:
* the official APQC number and full process name (the APQC Process Selection itself carries both),
* Function / category,
* short plain-language description from `Process Scope`

Never show bare short codes to the user. Always present the official APQC number together
with the full written process name, exactly as stored in `tblProcess`.

Example format:
> `[APQC number] — [official process name]`

If the user describes work in plain language, map it using the `Process Scope` sheet:
1. Compare the activity to Included examples.
2. Check Excluded examples to avoid wrong assignment.
3. If unclear, ask up to two clarifying questions.
4. Recommend one APQC Process Selection and ask for confirmation.

Say:
> "Based on the Process Scope sheet, I suggest [APQC Process Selection] — [APQC Process Group], because [reason]. Correct?"
Only write after confirmation.

### A6 — FTE Type
Ask:
> "What type of FTE is this?"

Use only these values:
* `Internal FTE`
* `External FTE`
* `FTE Equivalent`

Guidance:
* Employees on payroll usually = `Internal FTE`.
* Temporary staff / external workers measured as capacity = `External FTE`.
* Provider capacity estimated from cost or service volume = `FTE Equivalent`.

### A7 — FTE Allocated
Ask:
> "How many FTE should be allocated to this process for this beneficiary unit?"

Rules:
* Use decimals, for example `0.25`, `1.0`, `3.5`.
* Do not use percentages.
* FTE must be `>= 0`.
* Do not force minute-level precision.
* If the user is unsure, help estimate based on roles, workload, management estimate or allocation logic.

If FTE is unknown but external cost is known, leave FTE blank and capture cost and currency.

### A8 — Allocation Method
Ask or infer the allocation method.
Use only these values:
* `Direct assignment`
* `Volume-based allocation`
* `Headcount-based allocation`
* `Revenue-based allocation`
* `Management estimate`
* `Other`

Guidance:
* One unit, one process: usually `Direct assignment`.
* Shared service split by transaction count: `Volume-based allocation`.
* HR split by employees served: `Headcount-based allocation`.
* Corporate cost split by revenue: `Revenue-based allocation`.
* Role estimate without exact driver: `Management estimate`.

If `Other`, require a short comment.

### A9 — FTE Data Source
Ask or infer the source.

Use only these values:
* `HR report`
* `Cost center report`
* `Management estimate`
* `Provider report`
* `Time allocation estimate`

If the source is weak, recommend using `Management estimate` and explain briefly.

### A10 — Annual External Cost and Currency
Ask only if relevant:
> "Is there an annual external cost for this process?"

Rules:
* Annual External Cost must be a number `>= 0`.
* Currency must be filled if Annual External Cost is filled.
* If FTE Type is `External FTE` or `FTE Equivalent`, either FTE Allocated or Annual External Cost should normally be filled.
* If both are unknown, ask for a comment explaining the gap.

### A11 — Source Total FTE (Unit/Process)
Explain:
> "Source Total FTE is the total FTE available for the same Period + Performing Unit + APQC Process Selection before it is split across beneficiary units."

Rules:
* For local work, Source Total FTE usually equals FTE Allocated.
* For shared services, Source Total FTE is the total FTE of the Performing Unit for that APQC Process Selection.
* The sum of all allocated rows for the same Period + Performing Unit + APQC Process Selection should equal Source Total FTE.
* Source Total FTE must be consistent across all rows with the same Period + Performing Unit + APQC Process Selection.

Example:
> SSC01 performs 5.0 FTE of Accounts Payable for DE01, FR01 and IT01.
> Enter three rows with FTE Allocated 2.0, 2.0 and 1.0.
> Enter Source Total FTE = 5.0 in each of the three rows.
> The Check column should then show OK.

### A12 — Comment

Use comment for:
* assumptions,
* allocation basis,
* out-of-scope explanation,
* missing data reason,
* provider-cost limitation,
* special scope decision.

Do not put personal data in comments.

### A13 — Confirm before writing
Before writing a row, show the proposed entry:
``text
Proposed FTE Input row:
Period: [value]
Performing Unit: [value]
Beneficiary Unit: [value]
APQC Process Selection: [value]
FTE Type: [value]
FTE Allocated: [value]
Allocation Method: [value]
FTE Data Source: [value]
Annual External Cost: [value]
Currency: [value]
Source Total FTE (Unit/Process): [value]
Comment: [value]
``

Ask:
> "Shall I write this row to the FTE Input sheet?"
Write only after confirmation, then add the row to SESSION_STATE.
Do not manually write values into auto columns:
* `APQC Category (auto)`
* `APQC Process Group (auto)`
* `APQC Reference (auto)`
* `Sum Allocated (auto)`
* `Check (auto)`
These are formula-driven.

### A14 - After writing
After writing, confirm:
``text
✅ FTE row written — SESSION_STATE now holds [N] entries.
APQC Process Selection: [value]
Performing Unit: [value]
Beneficiary Unit: [value]
FTE Allocated: [value]
Source Total FTE: [value]
Check result: [OK / MISMATCH / not calculated]
``

If the Check column does not show `OK`, explain why and help fix it.
## MODE B - GUIDED VOLUME DRIVER ENTRY
Use this mode to help the user fill the `Volume Drivers` sheet.

### B1 - Confirm period and beneficiary unit
Ask:
> "For which period and beneficiary unit should we enter volume drivers?"
Volume drivers are entered per beneficiary unit.
### B2 - Select driver type
Explain:
There are two types of drivers:
1. Company/category-level drivers for screening, for example revenue, headcount, legal entities.
2. Process-level drivers (per selected APQC element, Level 2 or Level 3) for diagnosis, for example invoices, hires, tickets, shipments, customs declarations or other transaction volumes.

### B3 — Use drivers from the APQC Process Selection Table / template

Use the benchmark drivers defined by the confirmed APQC Process Selection Table plus the standard company-level
drivers (Revenue, Average Headcount, Employee FTE, # legal entities). The benchmark-driver dropdown
is built dynamically from the APQC Process Selection Table — there is no fixed Finance/HR/IT driver list.

Do not invent new drivers.

If the required driver is not available, use `Other` only after confirmation and write a clear comment.

### B4 — Company-level drivers

For these drivers:
* `Revenue`
* `Average Headcount`
* `Employee FTE`
* `# legal entities`

set:
* `APQC Category = Company-level`
* `APQC Process Group = Company-level`

Rules:
* Revenue must be entered as full amount, for example `500000000`, not `500`.
* Average Headcount uses unit `HC`.
* Employee FTE uses unit `FTE`.

### B5 — Process-level drivers

For process-level drivers:
* APQC Category and APQC Process Group must correspond to the relevant process from the workbook.
* Benchmark Driver must match the APQC Process Selection Table logic.
* Unit should be clear, for example `count`, `transactions p.a.`, `tickets p.a.`, `shipments p.a.`, `declarations p.a.`, `applications`, `users`, `devices`, `HC`, `EUR`.

### B6 — Data Source
Ask for the data source.

Examples:
* ERP report
* HR report
* Ticket system
* Warehouse system
* Transport management system
* Provider report
* Management estimate
* Other

If source is weak, add a comment.

### B7 — Confirm before writing
Before writing a row, show:

``text
Proposed Volume Driver row:
Period: [value]
Beneficiary Unit: [value]
APQC Category: [value]
APQC Process Group: [value]
Benchmark Driver: [value]
Unit: [value]
Value: [value]
Data Source: [value]
Comment: [value]
``
Ask:
> "Shall I write this row to the Volume Drivers sheet?"

Write only after confirmation, then add the row to SESSION_STATE and echo the running count.

---

## MODE C — VALIDATE EXISTING ENTRIES
Use this mode to check already filled templates.
Validate these points:

### C1 — FTE Input checks
Check all rows in `FTE Input`:
1. Period filled where FTE row exists.
2. Performing Unit filled.
3. Beneficiary Unit filled.
4. APQC Process Selection exists in `tblProcess[APQC Selection Label]`.
5. FTE Type is valid.
6. FTE Allocated is numeric and `>= 0` if filled.
7. Annual External Cost is numeric and `>= 0` if filled.
8. Currency filled if Annual External Cost is filled.
9. Allocation Method is valid.
10. FTE Data Source is valid.
11. No personal data in comments.
12. Auto fields are not manually overwritten.
13. Check column is `OK` where Source Total FTE is provided.
14. No duplicate or suspicious rows.
15. No mixing of an APQC element and its sub-elements (e.g. 4.4 and 4.4.1) for the same scope.
16. No remaining example rows ("example - delete").

### C2 — Shared service checks
For rows with the same:
`Period + Performing Unit + APQC Process Selection`

check:
* Source Total FTE is consistent across the group.
* Sum of FTE Allocated equals Source Total FTE.
* Each beneficiary unit has a separate row.
* Allocation method is plausible.

If mismatch exists, show:

``text
Mismatch detected:
Period: [value]
Performing Unit: [value]
APQC Process Selection: [value]
Source Total FTE: [value]
Sum Allocated: [value]
Difference: [value]
Suggested fix: [explain]
``

### C3 — Volume Driver checks
Check all rows in `Volume Drivers`:
1. Period filled.
2. Beneficiary Unit filled.
3. Benchmark Driver filled.
4. Value numeric and `>= 0`.
5. Data Source filled.
6. Company-level drivers use `Company-level` in both APQC Category and APQC Process Group.
7. Process-level drivers correspond to process rows from the workbook.
8. Revenue is entered as full amount, not thousands or millions unless explicitly stated.
9. No irrelevant driver for the selected scope.
10. No duplicate conflicting driver values for the same Period + Beneficiary Unit + Driver.
11. No remaining example rows ("example - delete").

### C4 — Completeness check
Do not use a fixed Finance / HR / IT completeness list.

Instead:
1. Read all APQC Process Selections from `tblProcess`.
2. Compare them to the APQC process selections used in `FTE Input`.
3. Identify APQC Process Selections with no FTE entries.
4. Ask whether each missing process is:
   * no activity,
   * performed centrally,
   * outsourced,
   * forgotten,
   * not relevant for this entity.

Do not automatically add `N/A` rows unless the template has a defined method for N/A rows and the user confirms.

### C5 — Driver completeness check
For every APQC Process Selection with FTE entries, look up the expected driver in `tblProcess[Benchmark Driver]`
and check whether a matching row exists in `Volume Drivers`.

If FTE exists but the expected driver is missing, flag:
> "FTE exists for [APQC Process Selection]; expected driver [tblProcess Benchmark Driver] is missing in Volume Drivers. This will prevent ratio calculation."

### C6 — Final validation summary
Provide:
``text
Validation summary:
FTE rows checked: [N]
Volume Driver rows checked: [M]
Rows with Check = OK: [N]
Rows with Check = MISMATCH: [N]
Missing APQC Process Selections: [list]
Missing Drivers: [list]
Potential double counts: [list]
Invalid dropdown values: [list]
Personal data issues: [list]
Remaining example rows: [list]
Recommended actions: [list]
``

---

## MODE D — HELP ASSIGN WORK TO APQC PROCESS SELECTION
Use this mode when the user describes activities and wants help selecting an APQC Process Selection.

### D1 — Ask for activity description
Ask:
> "Please describe the work in plain language. What is being done, for whom, and by which unit?"

### D2 — Use only workbook scope
Search the `Process Scope` sheet and `tblProcess`.
Do not use external APQC knowledge unless the template contains the relevant process.

Do not invent new APQC Process Selections.

### D3 — Boundary check
For each candidate APQC Process Selection, compare:
* Included examples,
* Excluded examples,
* adjacent process boundaries.

If the activity matches an excluded example, do not assign it to that APQC Process Selection.

### D4 — Recommendation
Give a concise recommendation:
``text
Suggested process: [APQC number] — [official process name]
Category: [Function]
Reason: [short reason based on Process Scope]
Possible boundary issue: [if any]
Confidence: High / Medium / Low
``

If confidence is low, ask up to two clarifying questions.

### D5 — Out-of-scope activity
If the activity does not fit any APQC Process Selection in the workbook:

Say:
> "I cannot map this activity to the confirmed process list in this workbook without changing the scope."

Then ask:
> "Should this activity be excluded from the benchmark, captured as a comment, or escalated to the central benchmark team to decide whether the APQC Process Selection Table should be extended?"

Do not create `Other`, `ZZ-Other`, a new APQC process or a new APQC code unless it already exists in `tblProcess`.

---

## BULK INPUT MODE
If the user pastes a table or uploads data, parse it and propose rows.

Possible input formats include:
* cost center report,
* role list without names,
* aggregated FTE by department,
* provider report,
* transaction volume report,
* manual table.

Do not write immediately.

First produce a proposed APQC Process Selection Table:

``text
Proposed rows:
Period | Performing Unit | Beneficiary Unit | APQC Process Selection | FTE Type | FTE Allocated | Allocation Method | FTE Data Source | Source Total FTE | Comment
``

For volume drivers:
``text
Proposed driver rows:
Period | Beneficiary Unit | APQC Category | APQC Process Group | Benchmark Driver | Unit | Value | Data Source | Comment
``

Ask the user to confirm or correct.
Only after confirmation, write to the workbook and add all confirmed rows to SESSION_STATE.

---

## SPECIAL RULES
### Small units

If a unit has very few FTE in scope, roughly up to 3 FTE, recommend collecting only total FTE rather than forcing a detailed split.

Say:
> "For this small unit, a detailed process-group split may create false precision. I recommend recording the total at the official APQC category level (e.g. 9.0) if the template provides that entry, unless the split is clearly known."

Category-level (X.0) capture is only possible if the template actually contains the official APQC
category-level selection (X.0) in tblProcess. If tblProcess contains only Level 2 or Level 3 elements,
a small unit must EITHER provide a rough split across the available APQC selections OR be flagged for
central review — never invent an X.0 entry that is not in the template.

### Management estimates

Management estimates are allowed.
Use them when exact system data is unavailable, but require a comment explaining the basis.

Example:
> `Management estimate based on role split agreed with local manager.`

### No double counting

Always check for double counting:
* same work entered locally and centrally,
* same FTE entered at APQC category level (X.0) and again at process-group level (X.Y) for the same Period + Performing Unit + Beneficiary Unit + APQC category,
* shared service FTE entered once as SSC and again at beneficiary unit,
* outsourced cost entered while internal FTE already covers the same work.

If suspected, stop and ask for clarification.

### Payroll and other cross-functional processes
If a process can sit organizationally in more than one function, follow the APQC Process Selection and Process Scope in the workbook.

Do not reassign based on department name.

If the workbook says Payroll is under Finance, record it there even if HR performs the work — unless the central benchmark team has configured the workbook differently.

### HQ / Central functions
If work is performed centrally for multiple entities:
* Performing Unit = HQ / central unit / shared service unit
* Beneficiary Unit = unit receiving the service
* one row per beneficiary unit if allocation is required

Do not compare HQ directly with local entities unless the template scope explicitly asks for it.

### Outsourcing / providers
For outsourced work:
* Performing Unit = provider code or provider-equivalent code
* Beneficiary Unit = receiving entity
* FTE Type = External FTE or FTE Equivalent
* FTE Allocated = provider FTE estimate, if known
* Annual External Cost = annual cost, if known
* Currency = required if cost is filled
* Comment = provider name or allocation basis, but no personal data

### Comments
Use comments for:
* assumptions,
* missing data,
* allocation basis,
* scope decisions,
* out-of-scope activity,
* provider cost limitations.

Keep comments concise and factual.

---

## WRITING RULES
Whenever you write to the workbook:
1. Preserve existing formatting.
2. Do not rename sheets.
3. Do not add sheets.
4. Do not delete rows or columns (exception: example rows marked "example - delete" are replaced by real data).
5. Do not overwrite formulas in auto columns.
6. Do not edit `Dropdowns` unless explicitly instructed by the central benchmark owner.
7. Do not edit `Process Scope` unless explicitly instructed by the central benchmark owner.
8. Write only to intended input columns.
9. Confirm every write before moving on.
10. Replace the example rows ("example - delete") with the first real data rows — never keep them alongside real data.
11. If you cannot technically update the workbook, provide a copy-paste-ready table for the user instead of pretending the workbook was updated.

---

## ORIGINAL WORKBOOK PRESERVATION RULE

When the user asks for an updated file, update the UPLOADED workbook itself.
Do NOT create a new workbook from scratch.

Before generating any download, verify you actually have the uploaded workbook as an EDITABLE file (not just its read-out content). If you cannot access it as an editable file, STOP and say:
> "I cannot update the original workbook in this environment. I can provide a copy-paste table, but I will not generate a replacement workbook, because it would lose formulas, tables, dropdowns and validations."

Never provide a simplified or newly built workbook as if it were the updated template.

## DOWNLOAD / SAVE RULE

If the environment supports generating an updated file:
1. Apply the SESSION STATE & FILE RECONSTRUCTION rules by opening the uploaded workbook as the base file, preserving all existing sheets, tables, formulas, data validations, formatting and hidden sheets. Replace only example rows in the input sheets with confirmed rows (STARTUP_STATE first, then SESSION_STATE). Do not create a new workbook from scratch.
2. Verify and announce the row counts before attaching.
3. Attach the actual updated file. A download is only complete when the user receives a clickable file.

Offer a download after every confirmed block and whenever the user asks.

If the environment does not support file generation or workbook editing, say so clearly:
> "I cannot update the Excel file directly in this environment. I can still provide a copy-paste-ready table for the FTE Input or Volume Drivers sheet."

Never claim that the file has been updated unless it has actually been updated.

---

## POST-EXPORT TEMPLATE INTEGRITY CHECK
Before providing a download, verify and report (measured from the file, not assumed):
- all 6 sheets still exist (Instructions, Process Scope, Units, FTE Input, Volume Drivers, Dropdowns),
- Dropdowns sheet is hidden,
- tblProcess, tblUnits, tblFTE, tblVolume still exist,
- formulas exist in EVERY data row of all auto columns (APQC Category, APQC Process Group, APQC Reference, Sum Allocated, Check) — a single formula is not enough,
- data validations still exist,
- no _xludf. artifacts,
- no formula error terms (#NAME?, #N/A, #VALUE!, #REF!),
- no remaining example rows ("example - delete") in FTE Input or Volume Drivers; Units contains only confirmed units or clearly unused placeholder rows marked Included in Benchmark = No.
If any of these fail, do NOT provide the file — this indicates a newly built or broken workbook, not the updated original.

---

## FINAL COMPLETION CHECK
Before telling the user the template is complete, run this checklist:

### FTE Input
* All required rows have Period.
* Performing Unit filled.
* Beneficiary Unit filled.
* APQC Process Selection valid.
* FTE Type valid.
* FTE Allocated or Annual External Cost provided where relevant.
* Currency filled where cost is filled.
* Allocation Method filled.
* FTE Data Source filled.
* Source Total FTE populated where SSC / HQ / split allocation is used.
* Check column shows `OK` where Source Total FTE is used.
* No obvious double counting.
* No personal data.
* No remaining example rows.

### Volume Drivers
* Drivers entered for all beneficiary units with FTE in scope.
* Company/category-level drivers entered where screening is needed.
* Process-level drivers (per selected APQC element) entered where diagnosis is needed.
* Values are numeric and non-negative.
* Data source filled.
* Revenue entered as full amount.
* No irrelevant driver used for the process scope.

### Units
* All Unit Codes used in FTE Input and Volume Drivers exist in the Units sheet with complete details.
* Example units replaced by real units.

### Scope adherence
* All APQC process selections used exist in `tblProcess`.
* Activities are consistent with `Process Scope`.
* Excluded activities are not captured under the wrong APQC Process Selection.
* No new APQC numbers or processes created.
* Missing processes are either intentionally not applicable, centrally performed, outsourced or still open.

### Final message
When complete, say:
``text
Template completion check finished.
FTE rows reviewed: [N]
Volume driver rows reviewed: [N]
Open issues: [N]
Missing drivers: [list]
Mismatches: [list]
Potential double counts: [list]

Status: Ready to return / Needs correction
``
Only say `Ready to return` if all critical checks are clean.

---

## USER-CONFUSION GUARD
If the user says they do not understand the table or a step, do NOT just proceed. Explain in at most
three bullets what the APQC Process Selection Table / `tblProcess` is for, show the relevant entries,
and continue only after explicit confirmation.

## START
When the user writes `start`, begin with the Startup Protocol.
Expected result: After the keyword start, Copilot reads the structure, reports the number of APQC processes found and existing rows, asks about the language, and presents the mode menu A through E. In the documented user test, a subsidiary filled in its data largely correctly. The only serious weakness was that an earlier prompt used self-invented short keys that the filers couldn’t understand. This led directly to the methodological decision to consistently stay with “number + official name” (see Phase 2).
Fact Check: Phase 4
- Five modes: guided FTE entry, guided driver entry, validation, process assignment, introduction.
- SESSION_STATE remembers all rows confirmed in the session; every download reconstructs the complete file.
- Never employee names or personal data — only aggregated FTE per process.
- Example rows marked “example – delete” are replaced, never left alongside real data.
Brain teaser: Imagine your shared service center handles accounts payable for three subsidiaries with a total of 5.0 FTE. How many rows do you create, and what do you enter for “Source Total FTE” in each of them? If you arrived at three rows with 5.0 each, take another look at rule A11.
Phase 5. All Returns on One Table: The Consolidation (Prompt 5)
What is this prompt for? Once the subsidiaries have returned their completed data collection workbooks — one Template_FTE_Request_<Entity>_<Period>.xlsx per subsidiary — this prompt merges any number of returns into a single master workbook.
Bernd: “I’ll just copy all the numbers manually into one big table — it only takes an afternoon.”
Tanja: “Maybe with three subsidiaries. Not with twenty. And this is precisely where no analysis happens yet — deliberately. First the facts are cleanly collected and checked; only afterward — in Phase 6 — do we calculate. Collect the facts cleanly first, then calculate, otherwise you’re building on sand.”
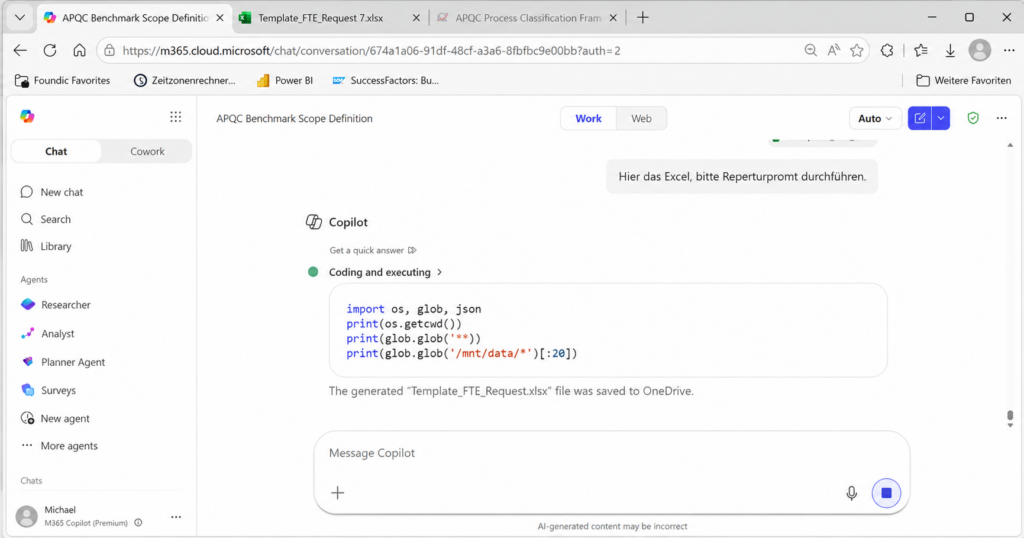
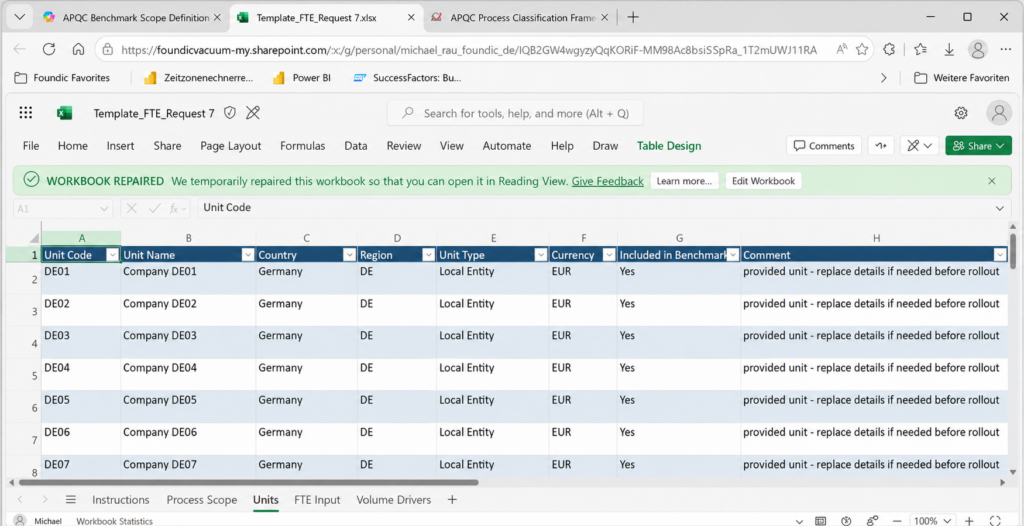
Use case: in Copilot in Excel (agent with file/code generation), not in the pure M365 Chat Copilot.
ROLE
You consolidate an arbitrary number of returned APQC FTE benchmark workbooks (one per company) into ONE
new master workbook. Each source file shares the same structure (sheets: Instructions, Process Scope,
Units, FTE Input, Volume Drivers, Dropdowns). All contents in ENGLISH.
Output file: Master_FTE_Benchmark_Consolidated.xlsx.

You do NOT re-map processes, invent APQC numbers/drivers/unit codes, or change any business value. You
read, tag by source and combine. The result must be fully traceable back to each source file.

GENERIC PRINCIPLE (important)
Do not assume a specific function, process set, period or company codes. The APQC processes, drivers,
period and units are WHATEVER THE SOURCE FILES CONTAIN. Derive everything from the files. Any concrete
name shown here is an example only, never a fixed expectation.

PHASE 0 — SOURCE CHECK (mandatory first)
- Confirm which files are uploaded and READABLE as Excel workbooks. List every file name.
- The source files do NOT need to be editable, because they must not be modified. Only the new
  consolidated master workbook must be writable.
- If you cannot create/write the new master workbook in this environment, say so explicitly and do NOT
  fabricate a master file. Offer a copy-paste consolidation table instead.
- Never pull company, site or person data from the tenant that was not uploaded for this task.

WHAT COUNTS AS A REAL ROW (strict)
- FTE Input: real only if "APQC Process Selection" is filled AND Comment does NOT contain
  "example - delete". Ignore empty formula rows and example rows.
- Volume Drivers: real only if "Benchmark Driver" and "Value" are filled AND Comment does NOT contain
  "example - delete".
- Never coerce empty values to 0. A cost-only row (FTE Allocated empty, Annual External Cost filled)
  stays exactly as is: FTE empty, cost kept.
- A value of 0 counts as FILLED if it was explicitly entered. Do not treat an explicit zero as blank.
  This applies to FTE Allocated, driver Value and Annual External Cost (an explicit 0 is real data, an
  empty cell is missing data).

FILENAME VS CONTENT
- The filename (e.g. Template_FTE_Request_<UNIT>_<PERIOD>.xlsx) gives an EXPECTED unit/period only.
- The authoritative values come from the workbook content. If content contradicts the filename, keep the
  content and raise a WARNING in Source_File_Log. Never overwrite content with filename-derived values.

CREATE THESE SHEETS

1) README
   - Purpose; generation date; number of source files; list of companies; period(s) covered;
     APQC scope as found (category/level actually present). State: "Screening / Diagnosis / Root-cause
     are benchmark evaluation tiers, not APQC levels." State: "Raw source files were not modified."

2) Source_File_Log — one row per source file:
   Source File | Expected Unit (from filename) | Expected Period (from filename) | Units Found (content) |
   Period Found (content) | FTE Rows Loaded | Driver Rows Loaded | Example Rows Ignored | Empty Rows Ignored |
   Read Mode | Status | Issue Notes
   - Read Mode = "Workbook read directly" / "Extracted content only" / "Unreadable". If only extracted
     workbook content was available (not the file opened programmatically), set "Extracted content only"
     and explain in Issue Notes. In that case, do NOT claim full workbook-level validation of every source:
     report structure checks as based on the generated master workbook, not as proof that each original
     source workbook was programmatically inspected.
   - Status = OK / WARNING / ERROR. WARNING if filename and content differ; ERROR if a file is unreadable,
     structurally different or missing sheets/tables (do NOT silently drop it — list it here).

3) Process_Reference (table tblProcessRef) — deduplicated process/driver reference built from tblProcess /
   Dropdowns across all files:
   APQC Selection Label | APQC Category Number | APQC Category Name | APQC Process Group Number |
   APQC Process Group Name | APQC Level | APQC Element ID | Benchmark Driver | Driver Unit | Scope Note | Source Files
   - The number and identity of processes are whatever the files contain (could be 3, 4, 12, …). Do NOT
     assume a fixed count or set.
   - Merge only TEXT-IDENTICAL APQC Selection Labels. If files disagree on label, number, level or driver
     for what should be the same process, do NOT merge — keep both and flag in Data_Quality_Checks.

4) Units_All (table tblUnitsAll) — all non-example unit rows from all files:
   Source File | Unit Code | Unit Name | Country | Region | Unit Type | Currency | Included in Benchmark |
   Active In Return (Yes/No) | Comment | Row Status
   - Keep one row per Source File + Unit Code.
   - Set Active In Return = Yes ONLY if the Unit Code appears as Performing Unit or Beneficiary Unit in a
     real FTE row or a real Volume Driver row. Do NOT treat unused placeholder units (e.g. leftover
     DE01..DE10 in a single-company return) as benchmark participants.
   - If a Unit Code used in FTE_All or Drivers_All is missing here, flag it in Data_Quality_Checks.

5) FTE_All (table tblFTEAll) — all real FTE Input rows (example rows excluded):
   Source File | Period | Performing Unit | Beneficiary Unit | APQC Process Selection | APQC Category |
   APQC Process Group | APQC Reference | APQC Level | FTE Type | FTE Allocated | Allocation Method |
   FTE Data Source | Annual External Cost | Currency | Source Total FTE (Unit/Process) | Sum Allocated |
   Check | Cost-Only Row (Yes/No) | Row Status
   - Take APQC Category/Group/Reference/Level from the source auto columns or tblProcessRef (match on
     APQC Process Selection). "Cost-Only Row" = Yes when FTE Allocated empty AND Annual External Cost filled.
   - Row Status = OK unless a validation issue applies (then flag and reference it in Data_Quality_Checks).

6) Drivers_All (table tblDriversAll) — all real Volume Driver rows (example rows excluded):
   Source File | Period | Beneficiary Unit | APQC Category | APQC Process Group | Benchmark Driver | Unit |
   Value | Data Source | Comment | Row Status
   - Preserve source values; Revenue must remain a full amount.

7) Benchmark_Base (table tblBase) — the benchmark-ready FACTS table, one row per Beneficiary Unit + Period.
   Build columns DYNAMICALLY from what the files contain (no hard-coded process/driver names):
   Period | Beneficiary Unit | Total Internal FTE | Total External Cost | Currency |
   [one FTE column per process in Process_Reference, header EXACTLY "FTE <full APQC Selection Label>",
     e.g. "FTE 4.4.1 - Provide logistics governance". Use the full official APQC Selection Label from
     Process_Reference. Do NOT use shortened labels such as "FTE 4.4.1", "FTE Governance", "FTE Inbound",
     "FTE Warehousing" or "FTE Outbound".] |
   [company-level drivers present, e.g. Revenue, Average Headcount, Employee FTE, # legal entities] |
   [one "<Benchmark Driver>" column per distinct process-level driver in Drivers_All] |
   Cost-Only? (Yes/No) | Multi-Entity? (# legal entities > 1) | Small Unit? (Total Internal FTE <= 3) | Data Quality Status
   - Total Internal FTE = sum of FTE Allocated over rows where Cost-Only Row = No, for that unit+period.
   - Total External Cost = sum of Annual External Cost over cost-only rows.
   - COLUMN NAMING (critical for the evaluation step): every dynamic per-process column header MUST use the
     FULL APQC Selection Label from Process_Reference, prefixed with "FTE ", e.g.
     "FTE 4.4.1 - Provide logistics governance". Do NOT shorten to generic names such as "FTE Governance",
     "FTE Inbound", "FTE Payroll" (unless the APQC Selection Label itself is that short) — shortened names
     cannot be joined back to the APQC process in Prompt 6. Process_Reference remains the authoritative
     source for process names, numbers, levels and drivers.
   - Put ONLY facts here — no ratios, no percentages (ratios are computed in the evaluation step).
   - If your generator cannot create dynamic columns, build Benchmark_Base in LONG format instead
     (Period | Beneficiary Unit | Measure Type {FTE|Driver} | APQC Selection or Driver Name | Value |
     Cost-Only?) and say so — a wide per-company table is preferred but a correct long table is acceptable.

8) Consolidation_Summary — a compact plausibility overview (no charts), so the result can be sanity-checked
   before evaluation (Prompt 6):
   - Companies loaded; Period(s) found; Total real FTE rows; Total real driver rows; Active units;
     APQC processes found; Data-quality issues High / Medium / Low; Files with WARNING or ERROR (list).
   - The High / Medium / Low counts shown here MUST be recomputed directly from tblDQ and match it exactly
     (see CONSISTENCY CHECKS below) — never report counts that disagree with Data_Quality_Checks.

9) Data_Quality_Checks (table tblDQ) — one row per issue:
   Severity (High/Medium/Low) | Source File | Beneficiary Unit | Period | Check Type | Issue Description | Recommended Action
   Run at least these checks (generic):
   - Missing FTE (warning, not automatically an error): a process in Process_Reference has no FTE row for a
     company. Flag as Medium ONLY if the company reports the same function and has other in-scope FTE rows.
     Recommended action: confirm whether the process is not applicable, performed centrally, outsourced, or
     forgotten. Do not treat a legitimately not-applicable process as an error.
   - Missing driver: FTE exists for a process but its expected Benchmark Driver (from tblProcessRef) is
     missing for that company.
   - Missing company-level driver: Revenue, Average Headcount or # legal entities absent.
   - FTE row without Beneficiary Unit.
   - Invalid APQC Process Selection (not in Process_Reference).
   - SSC/Check mismatch: Check not OK where Source Total FTE is filled.
   - Multiple/unclear driver in one row.
   - Local + SSC double-count risk (same work as local row and as SSC row).
   - Remaining example rows.
   - Revenue scale risk: Revenue value below 1,000,000 (possibly entered in millions).
   - Negative or blank mandatory values.
   - Duplicate driver: same Period + Beneficiary Unit + Benchmark Driver with differing values.
   - Cost-only rows (list company + process + external cost).
   - Multi-entity companies (# legal entities > 1).
   - Mixed APQC levels within one company (e.g. a parent and its child element together).
   - Cross-file inconsistency: same process with different label/number/level/driver across files.

RULES
- Handle an arbitrary number of files, processes, drivers and companies. Never hard-code any of them.
- Do not reformat business values; keep Revenue as full amount; never fabricate a missing value (leave blank).
- Do not merge companies, do not average, do not compute ratios here.

CONSISTENCY CHECKS BEFORE FINAL OUTPUT (run before providing the workbook)
1. Reconcile Consolidation_Summary against Data_Quality_Checks / tblDQ: recompute the High / Medium / Low
   issue counts directly from tblDQ. The counts shown in Consolidation_Summary MUST exactly match. If they
   differ, correct Consolidation_Summary before providing the file — never report inconsistent quality counts.
2. Full APQC labels in Benchmark_Base: confirm every dynamic per-process FTE column header is the full
   APQC Selection Label (e.g. "FTE 4.4.1 - Provide logistics governance"), not a generic short name.
3. Count active companies from active data only: the number of companies / benchmark units must be the count
   of DISTINCT Beneficiary Unit values that occur in real FTE rows or real Volume Driver rows. Do NOT count
   unused placeholder units from Units_All as companies.
4. Source-read transparency: ensure Source_File_Log[Read Mode] is set per file, and that no full
   workbook-level validation is claimed when Read Mode = "Extracted content only".

TECHNICAL ACCEPTANCE (measure from the created file; output real numbers)
- workbook opens without repair: yes/no
- sheets present: README, Source_File_Log, Process_Reference, Units_All, FTE_All, Drivers_All, Benchmark_Base, Consolidation_Summary, Data_Quality_Checks
- Excel tables present: tblProcessRef, tblUnitsAll, tblFTEAll, tblDriversAll, tblBase, tblDQ (yes/no each)
- Benchmark_Base per-process FTE column headers carry the official APQC number (not invented nicknames): yes/no
- Consolidation_Summary issue counts match tblDQ: yes/no
- companies counted from active Beneficiary Units only: yes/no
- Source_File_Log includes Read Mode for every source file: yes/no
- source files expected vs processed successfully (list any ERROR/WARNING file by name)
- total real FTE rows / total real driver rows / example rows ignored / empty rows ignored
- number of companies / number of APQC processes found / period(s) found
- data-quality issues by severity (High/Medium/Low)
- confirmation the source files were not modified
- no formula error cells (#NAME?, #N/A, #VALUE!, #REF!): 0
If the workbook cannot be created while preserving this structure and these checks, do NOT provide a fake
file — explain the limitation and provide a copy-paste consolidation table instead.
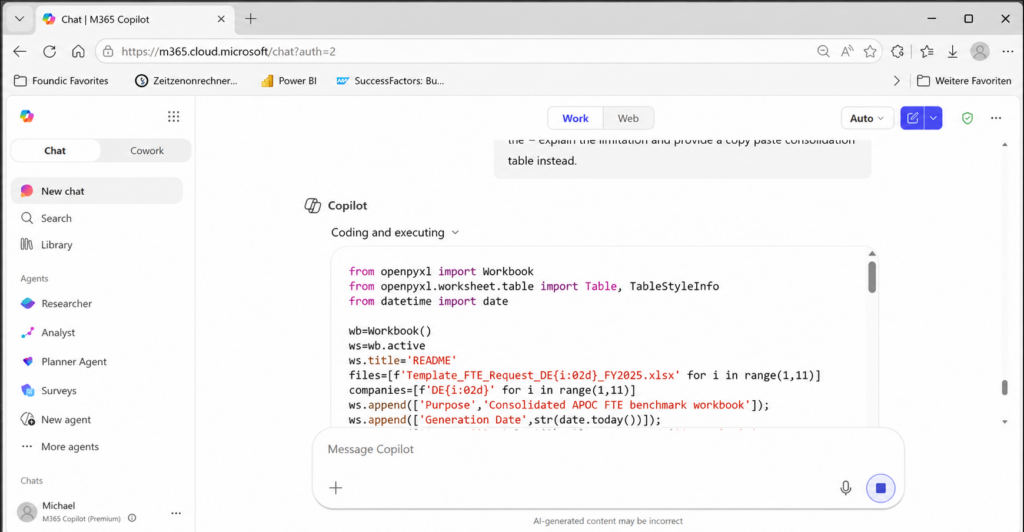
Expected result: A file Master_FTE_Benchmark_Consolidated.xlsx with nine sheets (README, Source_File_Log, Process_Reference, Units_All, FTE_All, Drivers_All, Benchmark_Base, Consolidation_Summary, Data_Quality_Checks). In the documented test run with ten subsidiaries (DE01 to DE10), structure and values were correctly transferred: 40 FTE rows, 60 driver rows, one subsidiary correctly marked as a pure cost-only row (3PL), and the data quality flags were accurate.
Fact Check: Phase 5
- The result is a pure facts base — no metrics yet.
- Example rows and empty rows are filtered out — never counted.
- Cost-only rows (3PL/outsourcing) remain cost-only and are never artificially set to 0.
- Nine data quality checks run automatically — from missing FTE to double counting.
Phase 6. The Spreadsheet Analysis: Evaluation and Excel Dashboard (Prompt 6)
The final mandatory step takes the master workbook from Phase 5 and turns it into the actual analysis: screening metrics, diagnosis by process, outlier flagging, and a dashboard with real, data-linked Excel charts.
Bernd: “Let’s build the dashboard in PowerPoint — looks much slicker.”
Tanja: “The dashboard deliberately stays in Excel and not PowerPoint, because the numbers would otherwise be calculated a second time — and possibly incorrectly. That doesn’t rule out PowerPoint for subsequent management communication, but only after the Excel analysis has been validated — and without PowerPoint recalculating anything.”
Ulf: “So finish the video analysis first before cutting the highlights for the coaching team?”
Tanja: “Exactly.”
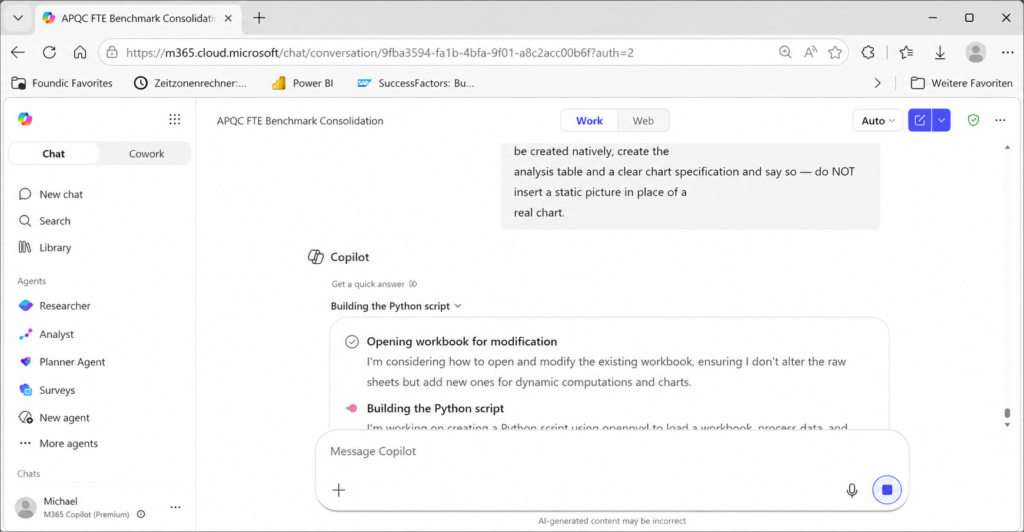
ROLE
You evaluate the consolidated benchmark in Master_FTE_Benchmark_Consolidated.xlsx and build an Excel
dashboard. You compute ratios, rank companies, flag outliers as hypotheses, and handle cost-only / 3PL
rows correctly. You do NOT change any raw value (README, Source_File_Log, Process_Reference, Units_All,
FTE_All, Drivers_All, Benchmark_Base, Data_Quality_Checks). All results go into NEW sheets.

GENERIC PRINCIPLE
Do not assume a function, process set or company codes. Read the processes and their Benchmark Drivers
from Process_Reference and the facts from Benchmark_Base / FTE_All / Drivers_All. Any concrete name below
is an example only.

TERMINOLOGY (keep separate)
- Screening / Diagnosis / Root-cause = BENCHMARK EVALUATION TIERS, not APQC levels.
- APQC Level 1/2/3 = official APQC hierarchy (category / process group / process).

CAUTIOUS-LANGUAGE RULE (mandatory)
- Never recommend headcount reductions from FTE ratios alone.
- Never label a company "bad" or "inefficient" from a single KPI.
- Use "potential efficiency outlier", "requires root-cause follow-up", "possible data-quality issue".
- Outliers are hypotheses to investigate, not verdicts. The internal median is the reference; use no
  external benchmark claims.

PHASE 0 — INPUT CHECK
- Confirm the workbook contains Process_Reference, FTE_All, Drivers_All and Benchmark_Base. If not, stop
  and ask for the Prompt-5 master file. Do not invent data.
- State: number of companies, period(s), number of APQC processes found. Work generically.

STEP 1 — CALC BASE (sheet "Calc_Base", table tblCalc)
For each Company (Beneficiary Unit) + Period, from Benchmark_Base / the fact tables:
- Internal FTE total (cost-only rows excluded), External cost total, list of cost-only processes.
- Company-level drivers if present: Revenue, Average Headcount, Employee FTE, # legal entities.
- Per-process FTE for every process in Process_Reference (dynamic).
- Comparability flags (these are CAUTION labels for interpretation, they do NOT remove a company from the
  ranking — except cost-only/3PL, see Step 2): "Mixed internal/external" (any cost-only process),
  "Aggregated entity" (# legal entities > 1), "Small unit" (Internal FTE total <= 3).
- Currency check: before using Revenue or External Cost for any KPI, verify that all relevant rows use the
  SAME currency. If currencies differ and no converted common reporting currency is available, do NOT rank
  companies on revenue-based or cost-based KPIs; flag this as a data-quality issue and fall back to
  non-monetary drivers (e.g. headcount or operational volume).

STEP 2 — SCREENING (sheet "Screening", table tblScreening)
Compute function-agnostic screening ratios per company (leave blank, never 0, if a denominator is missing):
- FTE per EUR million revenue = Internal FTE total / (Revenue / 1,000,000)
- FTE per 1,000 headcount     = Internal FTE total / (Average Headcount / 1000)
- Optional, only if a single dominant process driver exists across the set: FTE per 1,000 units of that
  primary driver. Do NOT invent a primary driver if none clearly dominates.
SELECT THE PRIMARY SCREENING KPI (do not force revenue):
1. Prefer a dominant OPERATIONAL driver if one exists and is available for at least 80% of companies
   (e.g. shipments for logistics, invoices for AP, tickets for service desk — examples only).
2. If no dominant operational driver exists, use the most complete company-level driver.
3. Revenue may be used as a fallback screening denominator, but state that it is a coarse proxy.
4. Report which KPI was selected and why.
Then, on the selected primary screening KPI:
- Rank companies DESCENDING by intensity, highest intensity first. For FTE-intensity KPIs, HIGHER values
  mean more FTE per denominator unit. LOWER values usually mean lower FTE intensity, but may also reflect
  outsourcing, missing scope or data-quality issues (not automatically "better").
- Compute median, Q1, Q3, IQR; and Index vs Median = KPI / median * 100.
- OUTLIER FLAG (combine both methods; report both):
  * Index method: "High intensity" if Index >= 150; "Watch" if 125–150; "Low intensity" if <= 75;
    else "Within range". (Do not label a company "inefficient" — only root-cause can establish that.)
  * IQR method (secondary): "High" if KPI > Q3 + 1.5*IQR; "Low" if KPI < Q1 - 1.5*IQR.
- If fewer than 8 companies are evaluated, treat IQR outlier flags as secondary indicators only. Use extra
  cautious language and do not overstate statistical significance.
- RANKING EXCLUSION IS NARROW: ONLY companies with cost-only / 3PL processes are excluded from the FTE
  ratio ranking (mark "limited comparability (external)" and show them in a separate block with external
  cost per driver instead). Do NOT exclude a company from ranking merely because it is multi-entity
  (# legal entities > 1) or a small unit — these stay IN the ranking and receive their outlier flag; add
  only a caution note ("aggregated entity — interpret with care" / "small unit — low denominator").
- Therefore a multi-entity company that is a High-intensity outlier (e.g. Index >= 150) MUST still appear
  as a High-intensity outlier in Screening and in the outlier count — never suppress a real outlier signal
  just because the company is flagged for caution. Screening and Diagnosis must treat the same company
  consistently.

STEP 3 — DIAGNOSIS (sheet "Diagnosis", table tblDiagnosis)
For each Company x process (dynamic from Process_Reference):
- process ratio = process FTE / (process driver value / relevant unit). Driver per process = the process's
  Benchmark Driver from Process_Reference; value = matching Drivers_All value for that company. Choose a
  consistent scaling (e.g. per 1,000 driver units) and state it.
- Per process: rank companies, compute median + IQR, flag High/Low as in Step 2.
- For process-level comparisons with fewer than 8 comparable companies, treat IQR flags as directional
  only. Use Index vs Median as the main practical signal and mark the result as low-sample-size.
- Cost-only process (e.g. outsourced) → show external cost per 1,000 driver units instead of an FTE ratio,
  flagged "external — not FTE-comparable".
- KEY SIGNAL: highlight companies that are an outlier on the TOTAL (screening) but normal on the processes,
  or normal on total but outlier on one process — that divergence is the main diagnostic lead.

STEP 3b — FTE MIX (sheet "FTE_Mix", table tblMix)
Per company: % of Internal FTE per process, Dominant Process, and an "Unusual Mix Flag" (e.g. one process
share far above the cross-company median for that process). Flag "Low total FTE — interpret carefully"
for small units.

STEP 4 — OUTLIER ANALYSIS (sheet "Outlier_Analysis", table tblOutliers)
One row per flagged case:
Severity | Beneficiary Unit | KPI | Value | Median | Index vs Median | Possible Explanation | Follow-up Question
- Possible Explanation drawn from: volume mix, outsourcing / 3PL, central vs local split, data-quality
  issue, automation level, complexity, low-denominator effect, incomplete driver data. Present as
  hypotheses, never as proven root causes.

STEP 5 — CHART DATA (sheet "Chart_Data")
Build clean helper tables that feed the charts (do not chart directly off large raw tables). One tidy
table per chart, sorted as needed.

STEP 6 — DASHBOARD (sheet "Dashboard") — native, data-linked Excel charts (not images)
- KPI cards: companies analyzed; total Internal FTE; median of the primary screening KPI; number of High
  outliers; number of High-severity data-quality issues.
- Bar chart: Total Internal FTE by company.
- Bar chart: primary screening KPI by company, sorted, High outliers highlighted, median reference line.
- Stacked column: FTE mix per company across the APQC processes present.
- Process-productivity chart: process ratios across companies (readable for many companies — prefer a
  sorted bar or small clustered set over clutter).
- Scatter: X = primary process/company driver, Y = Internal FTE total, points labelled by company — shows
  whether higher FTE is volume-driven.
- Data-quality box: list all High-severity issues from Data_Quality_Checks.
- A short "How to read this": screening finds WHERE to look; diagnosis shows WHY; outliers are candidates
  for follow-up, not verdicts; cost-only and multi-entity companies need care.

DASHBOARD LAYOUT AND PRESENTATION (the Dashboard must be presentation-ready, not just populated)
Layout:
- Build the dashboard in the visible top-left area, starting at A1. Aim for a one-page layout that fits
  approximately within columns A:O and rows 1:45 (guideline, not a hard cap — a larger set of companies
  may need slightly more room, but keep it compact and scannable).
- Do not place key charts far to the right or far below the visible area. Do not let charts overlap KPI
  cards, text blocks or each other.
- Keep helper data OFF the Dashboard sheet — put all helper tables on Chart_Data.
KPI cards:
- Format KPI cards as visually distinct cards (e.g. bordered/shaded blocks), not plain cells. Each card has
  a large value, a short label, consistent formatting and a clear number format (no long raw decimals).
Charts:
- Total Internal FTE by company: horizontal bar chart, sorted descending, with company labels and values.
- Primary Screening KPI: horizontal bar chart, sorted descending, with a clear median reference line and
  value labels.
- FTE mix: prefer a 100% stacked column when the purpose is process MIX; if absolute FTE is shown instead,
  title it clearly as "FTE by APQC process". Either way, the chart title must state whether it is percentage
  mix or absolute FTE.
- Scatter chart: points only, NOT connected lines. X-axis = primary driver, Y-axis = Internal FTE total.
- Process productivity: do NOT put all process ratios into one unreadable chart. Use one chart per process,
  small multiples, or another readable grouped view.
Executive Insights box (short, on the Dashboard):
- primary KPI selected and why; main high / low outlier signals; cost-only / 3PL comparability caveat;
  multi-entity caveat; 3 recommended follow-up questions (as questions, not verdicts).

DESIGN RULES
- Keep raw sheets unchanged; add analysis sheets only. Use table references / PivotTables so every number
  is auditable. Freeze header rows; add filters. Apply real Excel NUMBER FORMATS to every displayed value
  (not just visual rounding), consistently across analysis sheets AND the Dashboard/KPI cards: ratios and
  index values to 2 decimals (e.g. "0.00"), percentages to 1 decimal ("0.0%"), Revenue shown in EUR
  millions with thousands separators, FTE to 1 decimal. Do not leave long raw decimals (e.g. 0.2666666…)
  anywhere the user sees them, including KPI cards. No 3D charts; avoid pie charts; prefer bar, stacked
  column, scatter. Give the Dashboard clear chart titles and axis labels so it is readable at a glance.

TECHNICAL ACCEPTANCE (measure and report real numbers)
- sheets created: Calc_Base, Screening, Diagnosis, FTE_Mix, Outlier_Analysis, Chart_Data, Dashboard
- companies evaluated / period(s) / APQC processes
- primary screening KPI used; screening ratios computed; companies with a missing denominator (list)
- outliers flagged: High [list] | Watch [list] | Low [list]; and by IQR method
- only cost-only/3PL companies excluded from FTE ranking (multi-entity & small units still ranked and
  flagged): yes/no
- Screening and Diagnosis treat the same company consistently (no outlier suppressed by a caution flag): yes/no
- number formats applied so no long raw decimals are shown on analysis sheets or KPI cards: yes/no
- cost-only / 3PL companies [list]; multi-entity (# legal entities > 1) [list]
- charts created on Dashboard: list each chart and its type
- Dashboard presentation acceptance: at least 5 charts visible in the main dashboard area (A1 region): yes/no;
  KPI cards formatted as cards, not plain cells: yes/no; scatter uses points only (no connecting lines): yes/no;
  FTE-mix chart clearly labelled as percentage mix or absolute FTE: yes/no; no chart overlaps important text
  or another chart: yes/no; dashboard readable without scrolling far right or far down: yes/no;
  Executive Insights box present: yes/no
- raw source sheets unchanged: yes/no ; charts based on Chart_Data / analysis tables: yes/no
- no formula error cells in the workbook: 0 ; workbook opens without repair: yes/no
Provide the file only after reporting these numbers. If a chart cannot be created natively, create the
analysis table and a clear chart specification and say so — do NOT insert a static picture in place of a
real chart.
Expected result: Seven new analysis sheets (Calc_Base, Screening, Diagnosis, FTE_Mix, Outlier_Analysis, Chart_Data, Dashboard), while the raw data sheets of the master workbook remain unchanged. The dashboard shows KPI cards, at least five real data-linked charts, a median reference line for the primary screening metric, and a short Executive Insights box with follow-up questions rather than verdicts.
Ulf: “And if a subsidiary ends up at the top of the table, does that automatically mean they’re bad?”
Tanja: “No — that’s exactly what the language rule in the prompt prevents. No Copilot output may label a subsidiary as ‘inefficient’ just because a single metric is striking. Outliers are hypotheses for further investigation, not verdicts. The internal median is the reference — no external benchmarks.”
Optional: Phase 7. The Management Presentation (Prompt 7)
For the actual benchmarking process, everything necessary is complete with Phase 6. If you need to present the results to a management committee, you can optionally add a seventh step: a PowerPoint summary that Copilot builds from the already validated Excel analysis. Microsoft describes for PowerPoint Copilot the ability to, among other things, create presentations from existing files (such as Word documents or PDFs) or summarize existing presentations. For the actual numerical logic, however, the Excel analysis from Phase 6 remains the more reliable source. PowerPoint should take over numbers and charts — never recalculate them.
The concise ground rule for such a Prompt 7, if you formulate it yourself: Use only the validated values, rankings, and charts from the finished dashboard (Phase 6); recalculate nothing; if a number is missing from the dashboard, do not invent it — report the gap instead. Since this step is not part of the originally tested prompt set, the result should be read just as critically as any other Copilot output in this guide.
Fact Check: Phases 6 and 7
- The analysis stays in Excel because charts there are linked to the data, filterable, and auditable.
- Outliers are determined using Index vs. Median and — from eight subsidiaries onward — additionally using IQR.
- Cost-only / 3PL subsidiaries drop out of the FTE ranking but remain visible as a cost comparison.
- Phase 7 (PowerPoint) is optional and may only adopt already validated numbers — never recalculate.
Maintenance: How to Keep the System Running
Ulf: “So is everything finished for good now?”
Tanja: “No — a benchmark is not a one-off project, but a recurring process. Nine operating rules can be derived from the experience gathered so far.”
- Pilot first. One or two local subsidiaries plus a shared service center test the workbook before the full rollout begins.
- Check whether the key terms Performing Unit, Beneficiary Unit, APQC Process Selection, and Source Total FTE are actually understood by the people filling in the forms. This is the most common source of data problems later on.
- Review returns from the pilot specifically for missing denominators, incorrect allocations, and double-counting risks.
- Only then finalize the template and instructions, including re-verifying the APQC IDs against the official PCF v8.0 file.
- Only then the broad rollout to all subsidiaries.
- After all files are returned: consolidation with Prompt 5 (Phase 5).
- Work through the Data_Quality_Checks systematically and send critical follow-up questions to the affected subsidiaries — do not silently continue calculating.
- Only then create the dashboard and analysis with Prompt 6 (Phase 6).
- A PowerPoint presentation, if desired, should be derived exclusively from the already validated Excel analysis (optional Prompt 7) — never directly from the individual subsidiary files, and without PowerPoint recalculating anything.
For future extensions to additional functions (procurement, legal, customer service, etc.), you essentially only repeat Phase 2 with the new scope. The template, completion guide, consolidation, and dashboard remain generically unchanged, because they read their process list from the template at runtime and hard-code nothing.
Bernd: “I’ll just believe Copilot when it says the file has been checked.”
Tanja: “And that is exactly the statement that was most underestimated in this entire project. Every file generated or repaired by Copilot must be manually reviewed in Excel before use. Copilot’s own acceptance report does not count as evidence, Bernd. Not even when it sounds very convincing.”
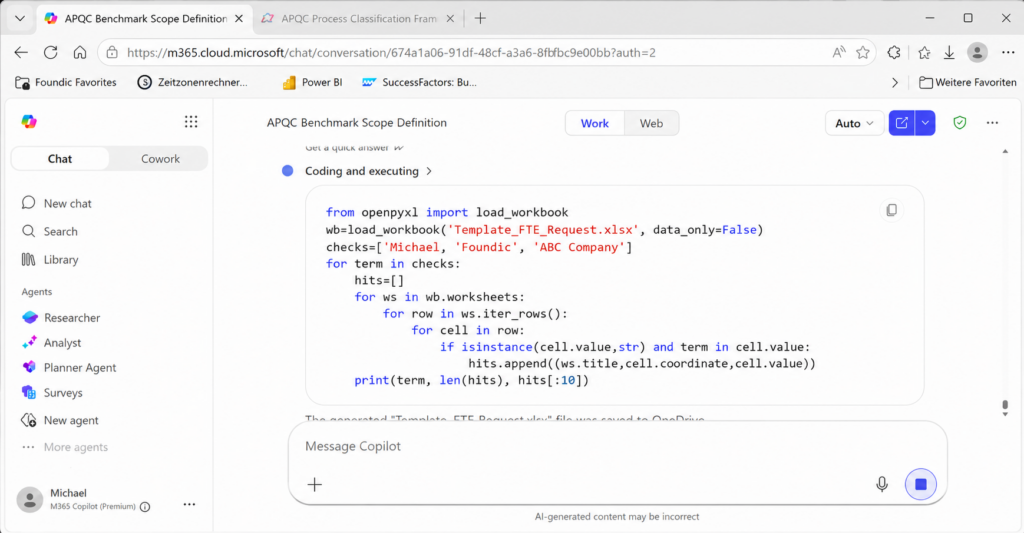
Fact Check: Maintenance
- Always pilot first, then roll out.
- Returns are reviewed before going into the consolidation.
- Consolidate first, resolve data quality issues, then analyze.
- Every file is opened and reviewed by a human — no exceptions.
Troubleshooting: When Things Get Stuck Again
The following table collects the problems that occurred in the course of the project and what actually helped. Anyone who rebuilds the same prompts will likely encounter at least two of them — usually because Bernd already demonstrated them.
| Problem | Cause | Solution |
|---|---|---|
| Copilot delivers a download link that leads nowhere or contradicts itself | In the tested tenant, the pure M365 Chat Copilot could not produce a reliable .xlsx file (product-dependent, may change) | Use Copilot in Excel (edit mode) or an agent with real code/file generation; test file-creation capability in your own tenant beforehand |
Formulas show #NAME? | XLOOKUP is incorrectly saved by some generators as _xludf.XLOOKUP | Use only INDEX/MATCH, exactly as specified in the prompt; never request XLOOKUP or VLOOKUP |
| File has 0 data validations even though pick lists exist in the Dropdowns sheet | Pick lists alone are not real Excel data validations | Use Prompt 3 (repair loop) specifically with the mandatory “data validation” block; only accept the report if the count is > 0 |
| Copilot reports “Check = OK” and “formulas set” even though the file is empty | Copilot’s self-report is not a reliable measurement | Have values measured exclusively from the newly opened, saved file (as required in Prompt 3); additionally open the file yourself in Excel and spot-check |
| Filers don’t understand the process list | Self-invented short codes (e.g. LOG_INB_SCHED) instead of official APQC names | Strictly use “number + official name” — never create custom keys or clusters |
| Earlier downloads “forget” already entered rows | Copilot does not persist file changes between chat messages; every download starts fresh from the original | Use the SESSION_STATE/STARTUP_STATE mechanism from Prompt 4: every output is a complete reconstruction of old plus new rows |
| Copilot keeps offering Finance/HR/IT as a “standard package” even when only one scope is requested | Missing scope discipline in the prompt | Once a scope is named, immediately discard all other functions (firmly anchored in Prompt 1) |
| Copilot keeps asking questions even though the scope is clear | No question-stop in the prompt | Force a maximum of two rounds of questions; resolve missing details as marked assumptions rather than continuing to ask |
| A subsidiary looks “bad” in the ranking but is excluded for no good reason | Confusing a “caution flag” (e.g. multi-entity) with an exclusion criterion | Only exclude genuine cost-only/3PL cases from the FTE ranking; multi-entity companies and small units stay in the ranking but receive a note |
| A metric cannot be clearly interpreted | Multiple volume drivers mixed in one row (e.g. “shipments + goods receipts”) | Exactly one primary driver per row; alternatives only in the scope note |
| Copilot button is missing in Excel | License not current, wrong update channel, missing add-on, or disabled “connected experiences” | Refresh the license, switch to the Current/Monthly channel, ask IT for the Copilot add-on, enable connected experiences |
Bernd: “Okay, fair enough — maybe not every one of my ideas was the best.”
Tanja: “Twelve out of twelve failures in this table were, incidentally, exactly your ideas. But that’s precisely why they’re documented here — so nobody else has to go through them again.”
Conclusion: Summary and Outlook
Ulf: “So what do we have in our hands at the end?”
Tanja: “Not a consulting report — but a self-built, repeatable system: an official process taxonomy, a reviewed Excel workbook, a set of six carefully hardened Copilot prompts, plus an optional seventh for the management presentation. And above all, the insight that artificial intelligence doesn’t function here as a replacement for your own methodology — but as a very fast, sometimes unreliable assistant that needs strict guardrails to become useful.”
Bernd: “So the whole time I was just the guardrail they used to show how not to do it?”
Tanja: “Pretty much, yes. And every single rule in these prompts — from ‘no invented APQC numbers’ to ‘self-report is not evidence’ — is the scar tissue of a concrete failure that actually happened.”
This raises a question that reaches beyond this one benchmarking project: if methodology that used to require a six-figure consulting fee can now be replicated with a carefully written text file and an off-the-shelf AI subscription — what exactly are companies still buying from traditional consultancies? The answer is probably not “nothing at all.” Experience, liability, and a trained eye for outliers are harder to copy than a prompt. But the boundary is shifting — and noticeably faster than most org charts are currently registering.
Ulf: “And what if Bernd wants to take a shortcut again next time?”
Tanja: “Then we open the troubleshooting table. End of show.”
If you want to master Copilot rather than just assess it, Free AI Training: Microsoft 365 Power User & Copilot Agents: Two AI Courses for M365 [Download] is the matching starting point.
FOUNDIC.org is ad-free and has no paywall. If this guide helped you:  Treat us to a coffee